
The investment environment over the last few years has been particularly challenging, causing the Stable Fund’s return to be more volatile than it has been historically. Stephan Bernard and Radhesen Naidoo take a critical look at the Fund’s performance, the approach taken to deliver this performance, and assess whether it is meeting its objectives. They also look at how the Fund is positioned today to continue delivering on its objectives.
At Allan Gray, our investment philosophy recognises that to achieve our objectives, we must focus on the longer term, and this approach flows through into the portfolio management of our funds. The Stable Fund is no exception.
The Stable Fund has a dual objective of beating an absolute benchmark of cash plus 2% over the long term, while also minimising the risk of capital loss over any two-year period. A key component of the Stable Fund’s return is generated by our bottom-up stock-picking ability and therefore the equity exposure. Typically, a greater equity exposure increases the possible return over the longer term, but also increases volatility over the shorter term. At the same time, though, the Fund must continue to balance the risk of capital loss over a shorter two-year period. It may appear, then, that achieving the objectives of the Fund would be at odds. Addressing each of these objectives in turn by analysing the Fund’s history provides us with comfort that we are still on track.
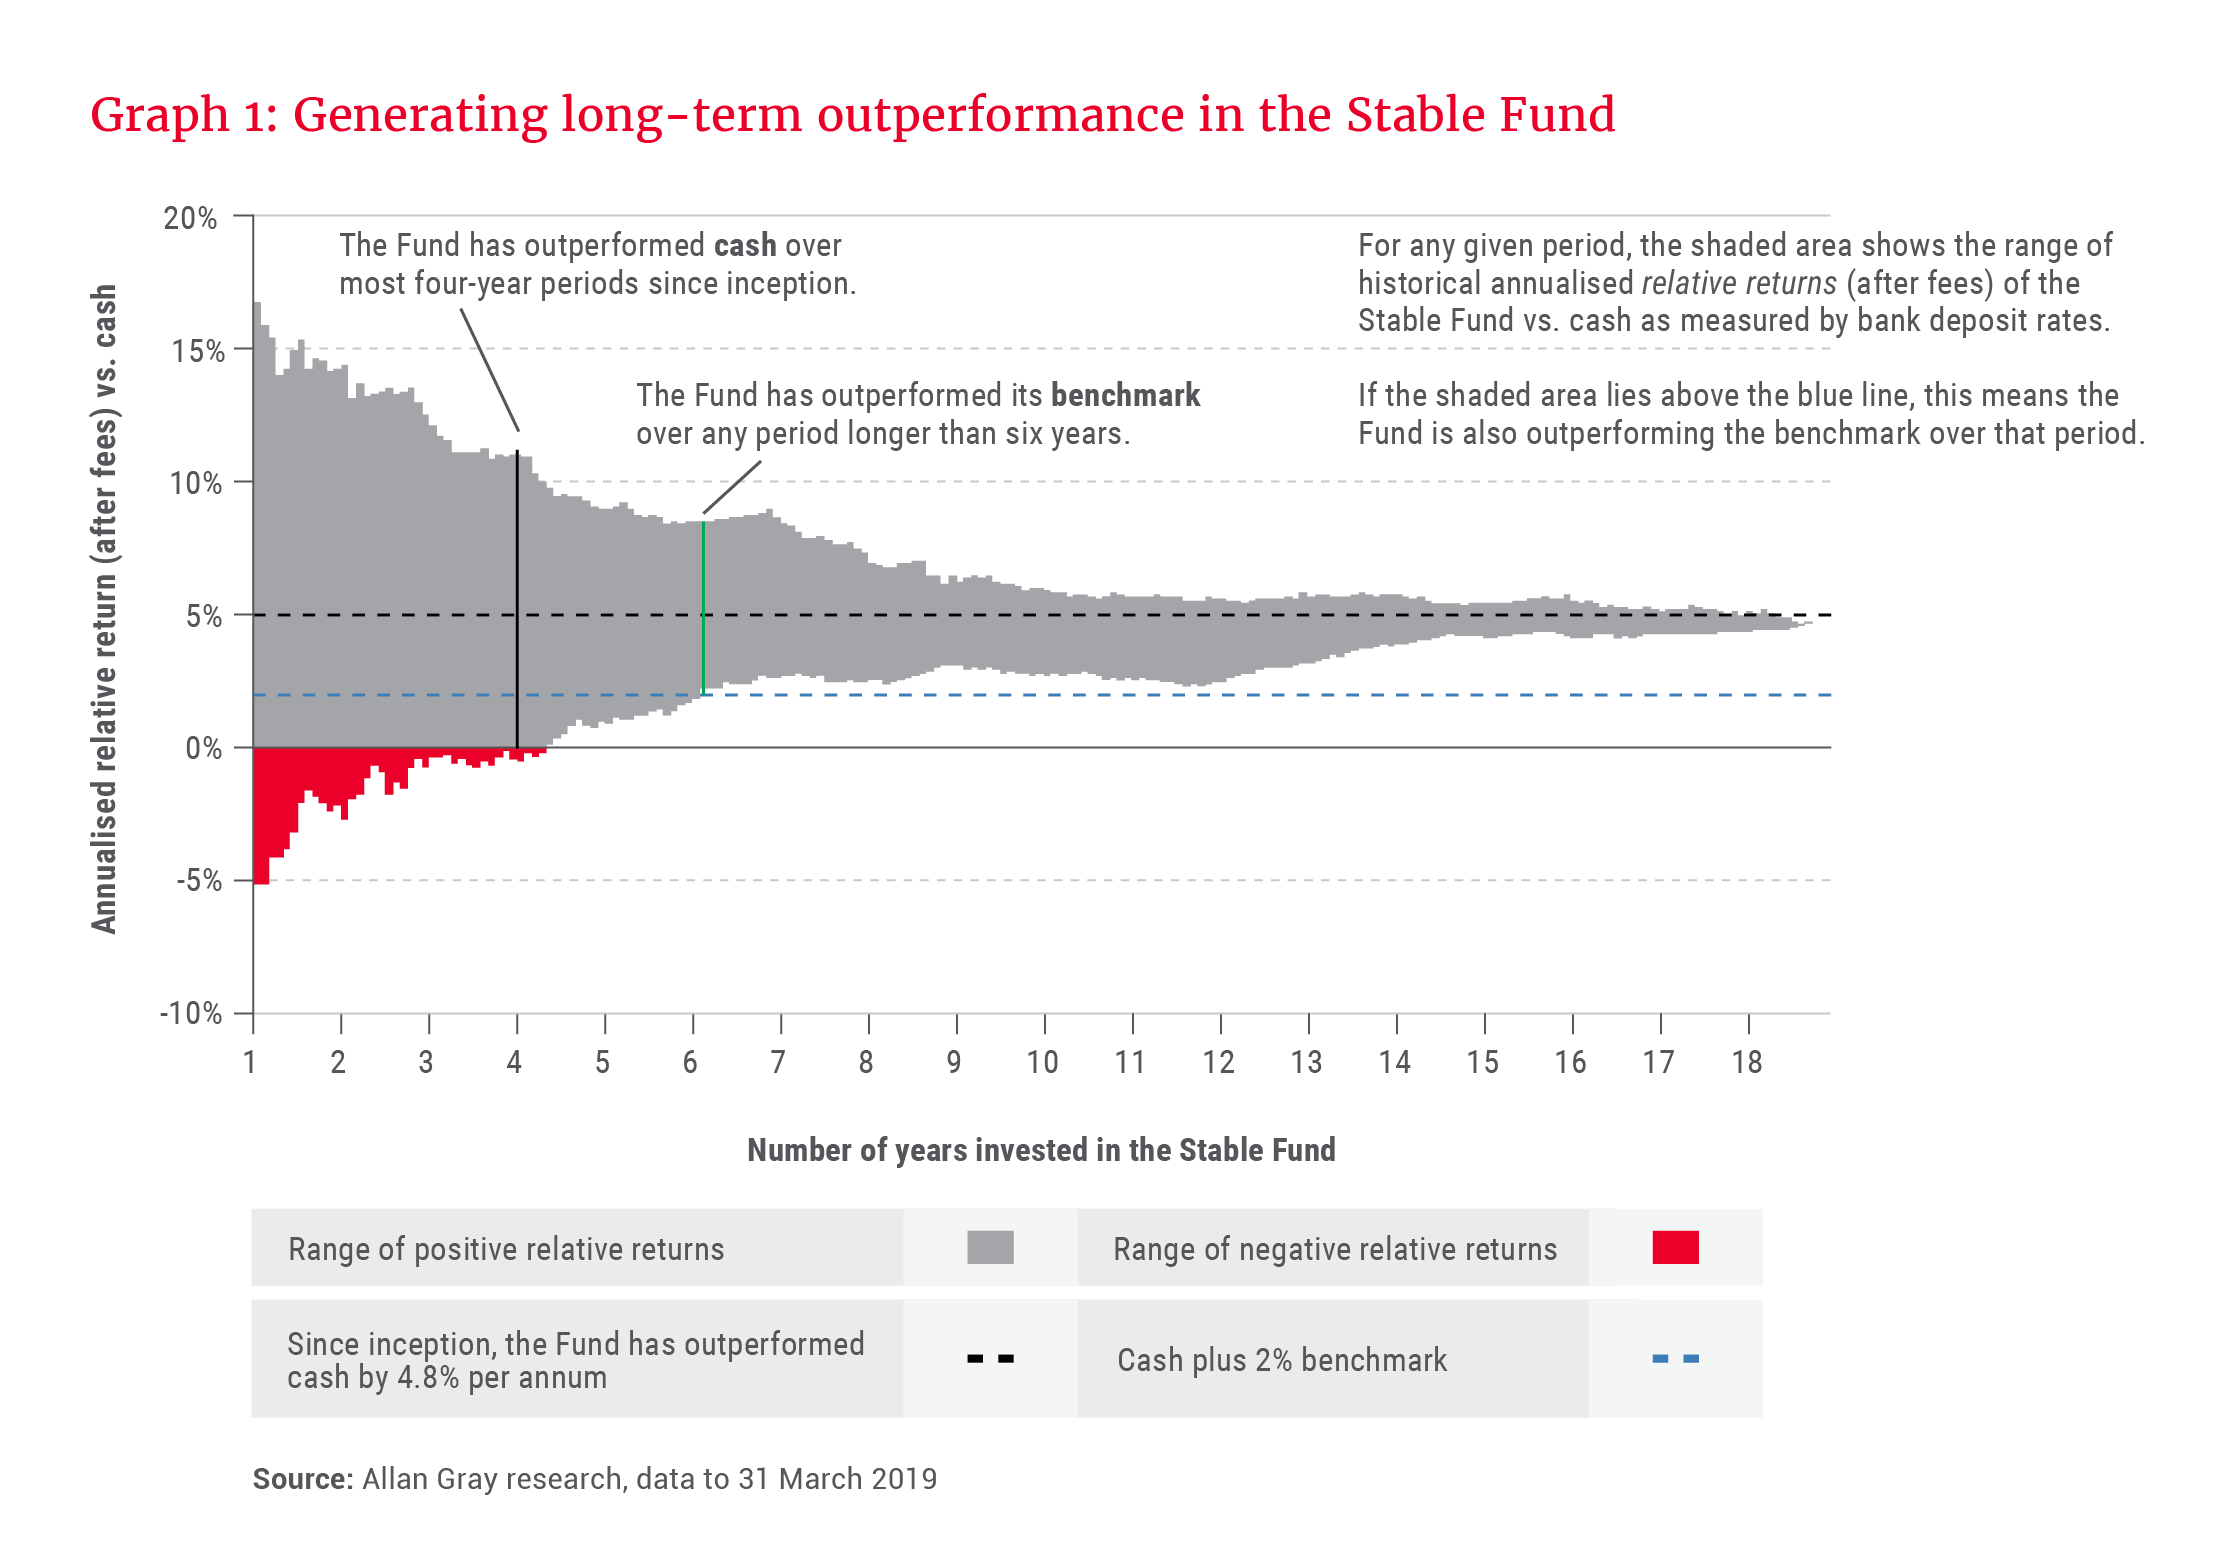
Graph 1 shows the range of annualised relative returns (after fees) compared to cash achieved over any given period to 31 March 2019. Measured over most four-year periods, the Fund has been successful in beating cash returns, and since inception has outperformed cash by 4.8% per year. The Fund aims to beat its benchmark, which is cash plus 2%, in order to generate long-term real returns and protect your purchasing power. Measured against the benchmark (illustrated by the dotted blue line) over a four-year period, the Fund has outperformed 87% of the time, and outperformed over any period longer than six years. This is a pleasing outcome, with underperformance expected from time to time.
Achieving this level of outperformance is a good result. However, the Fund still needs to protect against the risk of capital loss over a two-year period. That is, if we adjust Graph 1 to show the absolute returns only, have we managed to deliver positive returns over two years?
Graph 2 addresses this question by showing the range of annualised absolute returns (after fees) achieved by the Fund over any given period to 31 March 2019. The red bar highlights the returns achieved over two-year periods.
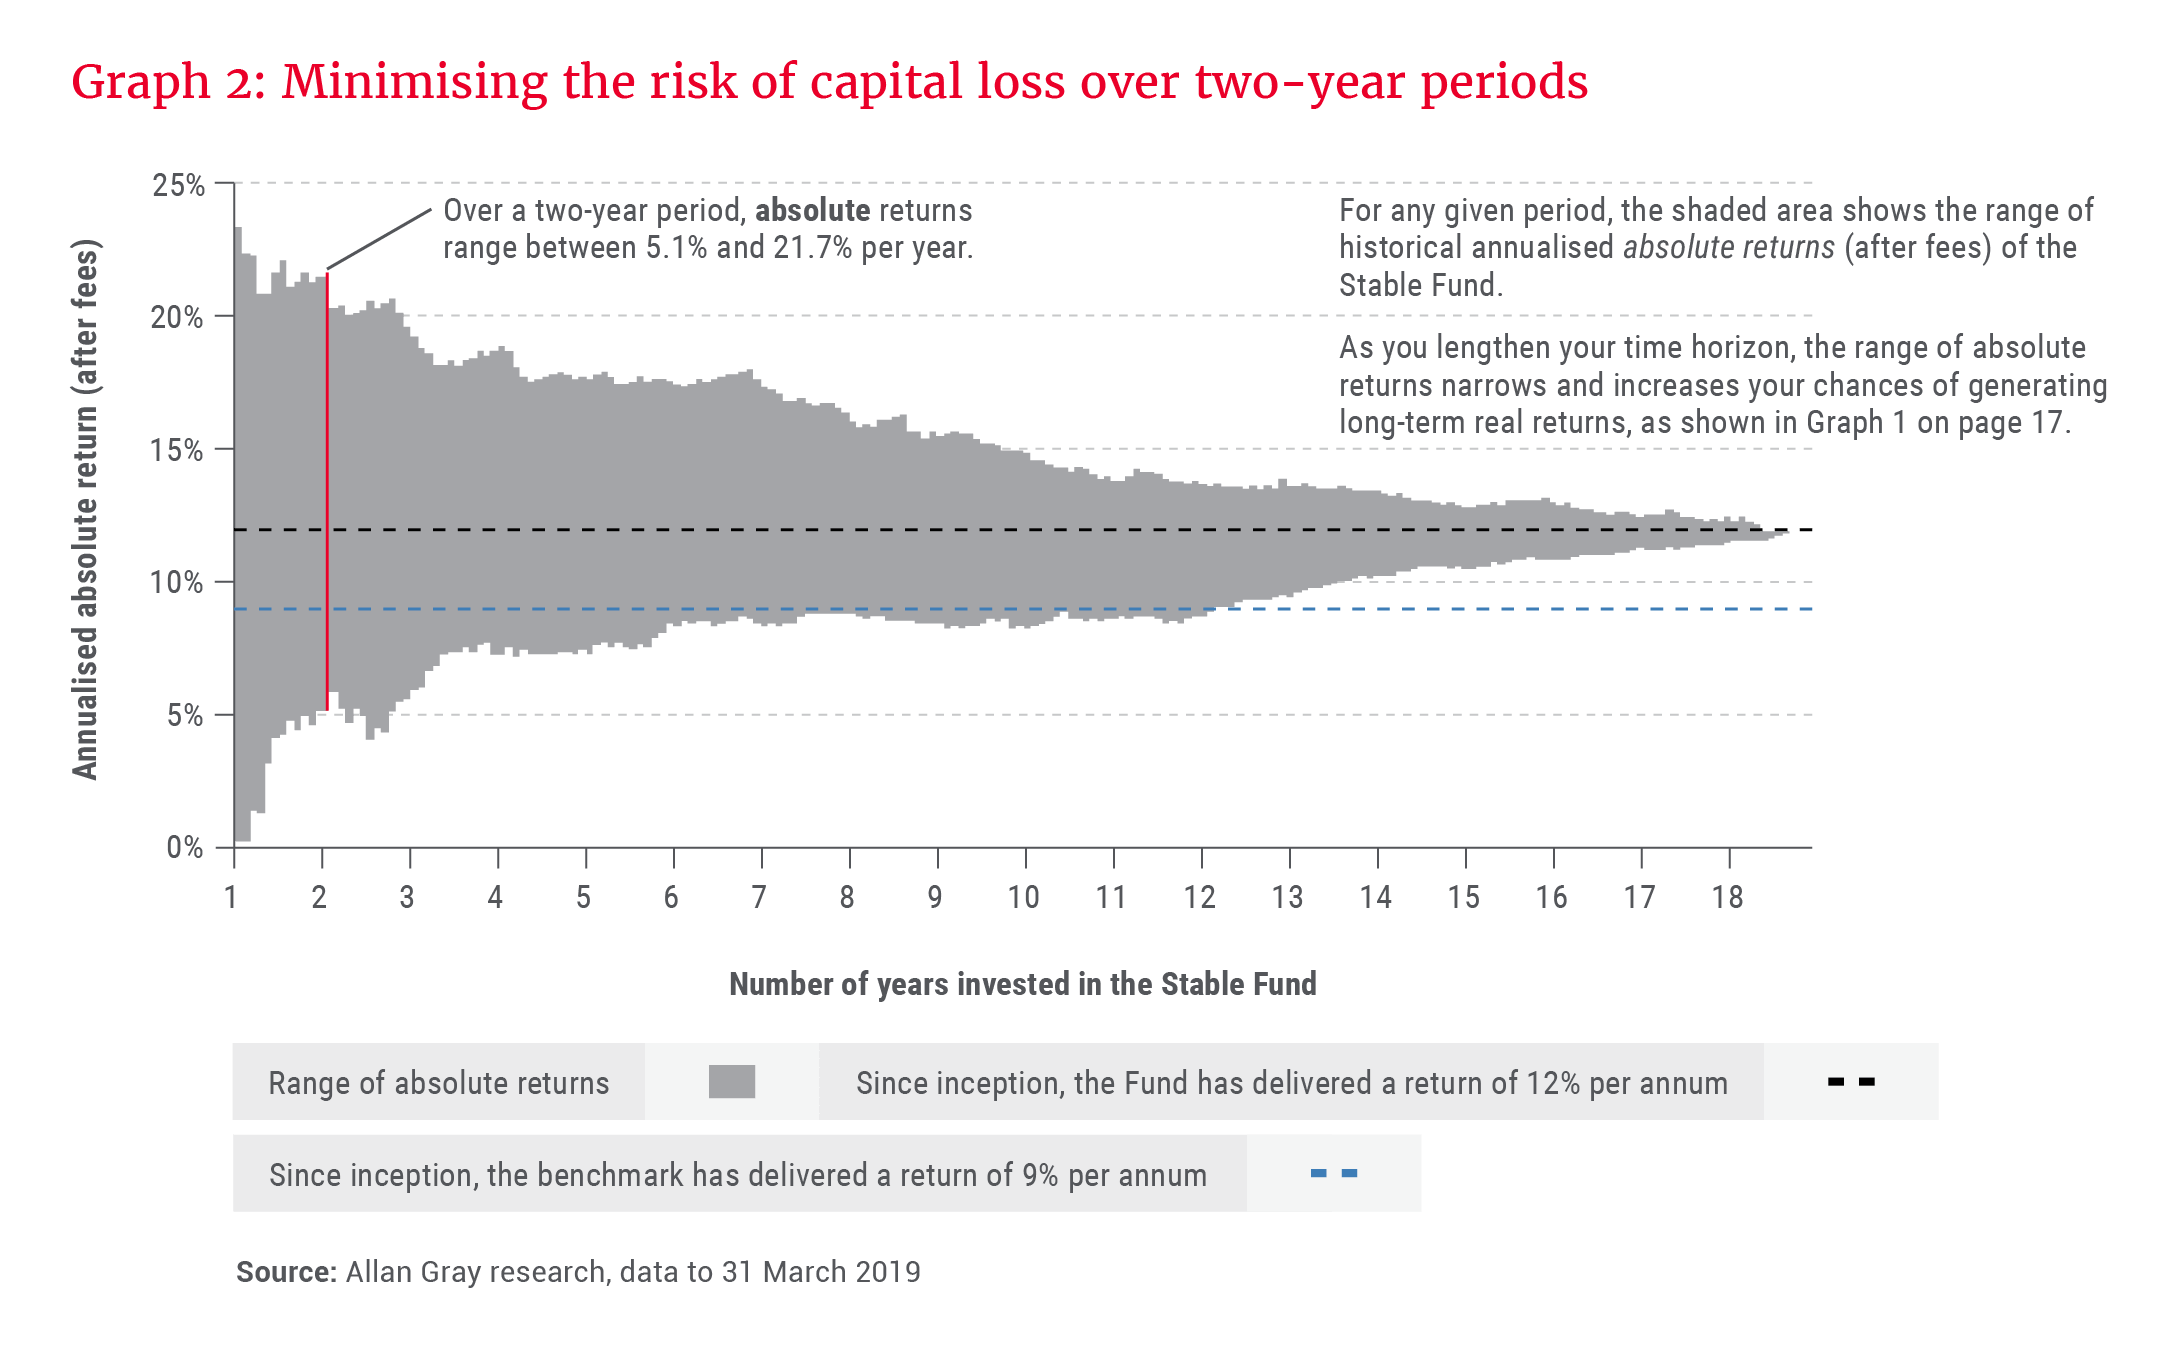
In line with the Fund objective, returns have always been positive, ranging between 5.1% and 21.7% per year. Interestingly, this also holds true over a one-year period, but the range of returns has been wider. Despite recent weaker performance, we are therefore pleased with the outcome achieved: capital preservation over the shorter term, and long-term returns well ahead of the benchmark.
How have we achieved these objectives?
The Stable Fund can invest in the full range of available asset classes, and each investment made is competing for a place in the portfolio. The portfolio managers’ job is to assess how these investments add to or detract from achieving the Fund objective when combined, and this informs the Fund’s positioning.
A core strength of our investment approach is that we build our asset allocation funds from the bottom up. Simplistically, this means we start by looking at individual shares and compare how attractive they are relative to cash, and investments in other asset classes, such as bonds, property, commodities and foreign investments.
We also recognise that equities tend to outperform other asset classes over longer periods of time – but also exhibit higher volatility. Therefore, we may increase the Fund’s exposure to equities when we are able to identify many cheap shares through our bottom-up investment process, and vice versa, so that we can put your savings to work at the most opportune times and cut back on risk when shares are expensive, and the risk of loss is high.
So how can we gauge if the Fund has achieved its objectives without exposing our clients to unnecessary risk? There are a number of classical risk measures one could use, but few of them purely focus on the risk of permanent capital loss, which is how we define investment risk.
One useful measure to consider is how a fund performs during up and down markets, which we can term as “downside capture” and “upside capture”. Downside capture is calculated by looking only at the months when the FTSE/JSE All Share Index (ALSI) delivered negative returns, which we refer to as down months. We then calculate the average return achieved by the fund, divided by the average return achieved by the ALSI during the down months. This produces a percentage that illustrates how much the fund loses on average for every 1% downward move in the ALSI. Upside capture, conversely, is the same measure calculated during the months the ALSI delivered a positive return.
Let’s say downside capture was 30%: This simply means that, on average, for every 1% downward move in the ALSI, the fund would have gone down by 0.3%. Plotting the downside capture against the upside capture can help us understand how each fund generates its returns. Graph 3 plots this for a 10-year period to 31 March 2019 for the Allan Gray Stable Fund and all the funds in its peer group that have 10-year track records.
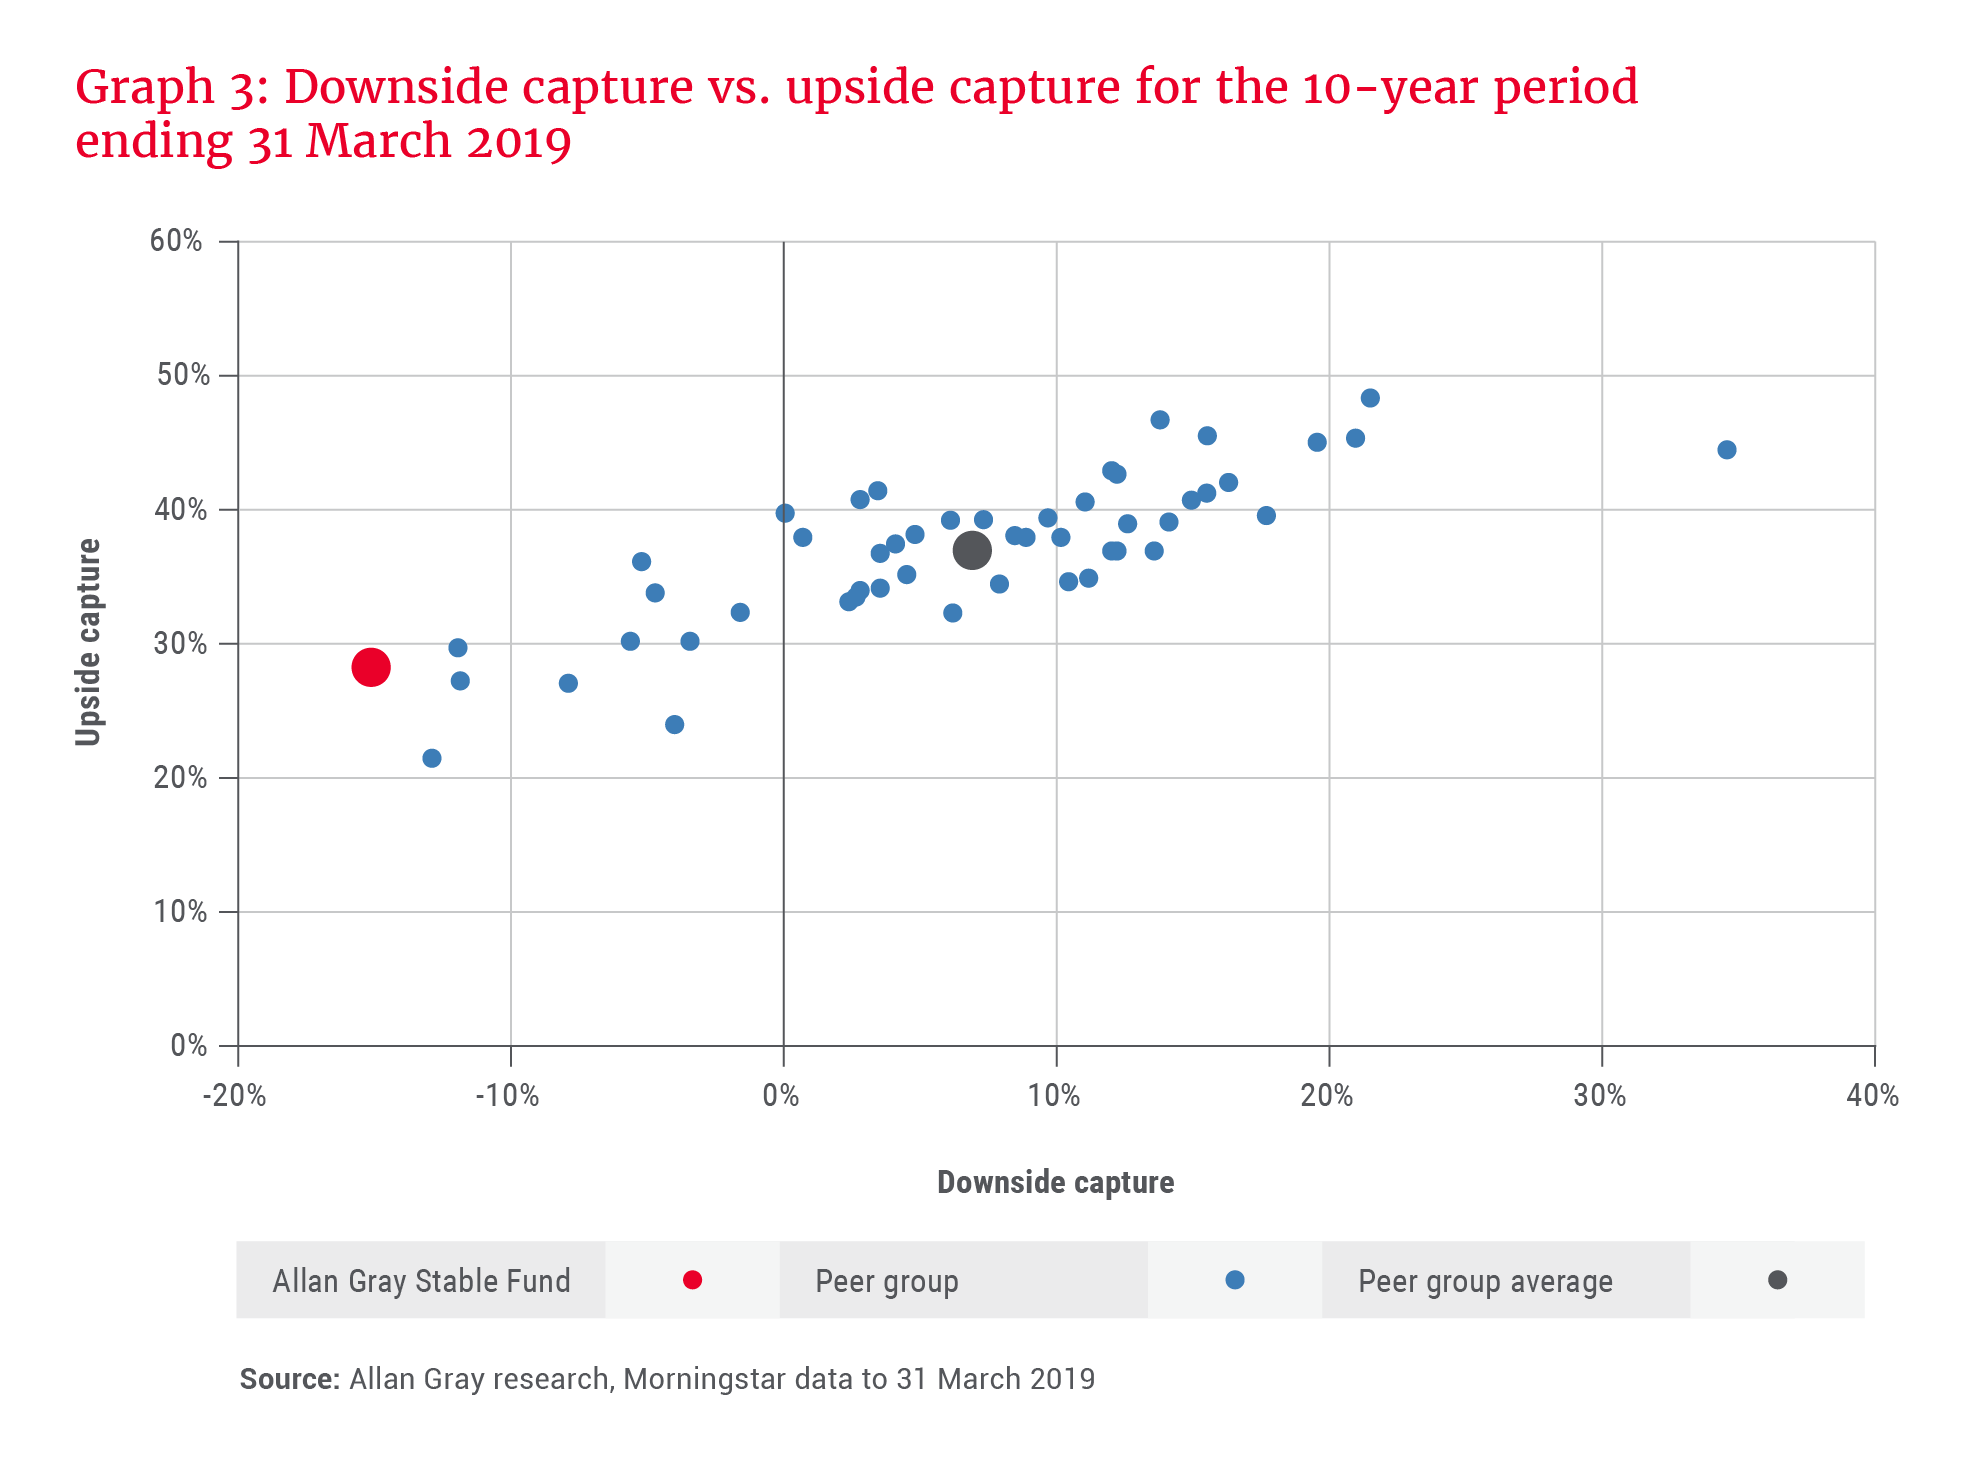
This produces an interesting picture. Over the period, the Stable Fund has the lowest downside capture. The reading is actually negative, which means that, on average, when the ALSI has gone down, the Fund has delivered a positive return (which it in fact has since the Fund’s inception). However, to achieve this, the Stable Fund had lower upside capture compared to its peer group, driven primarily by a lower net equity weight over the period. Does this mean we sacrificed returns during this period?
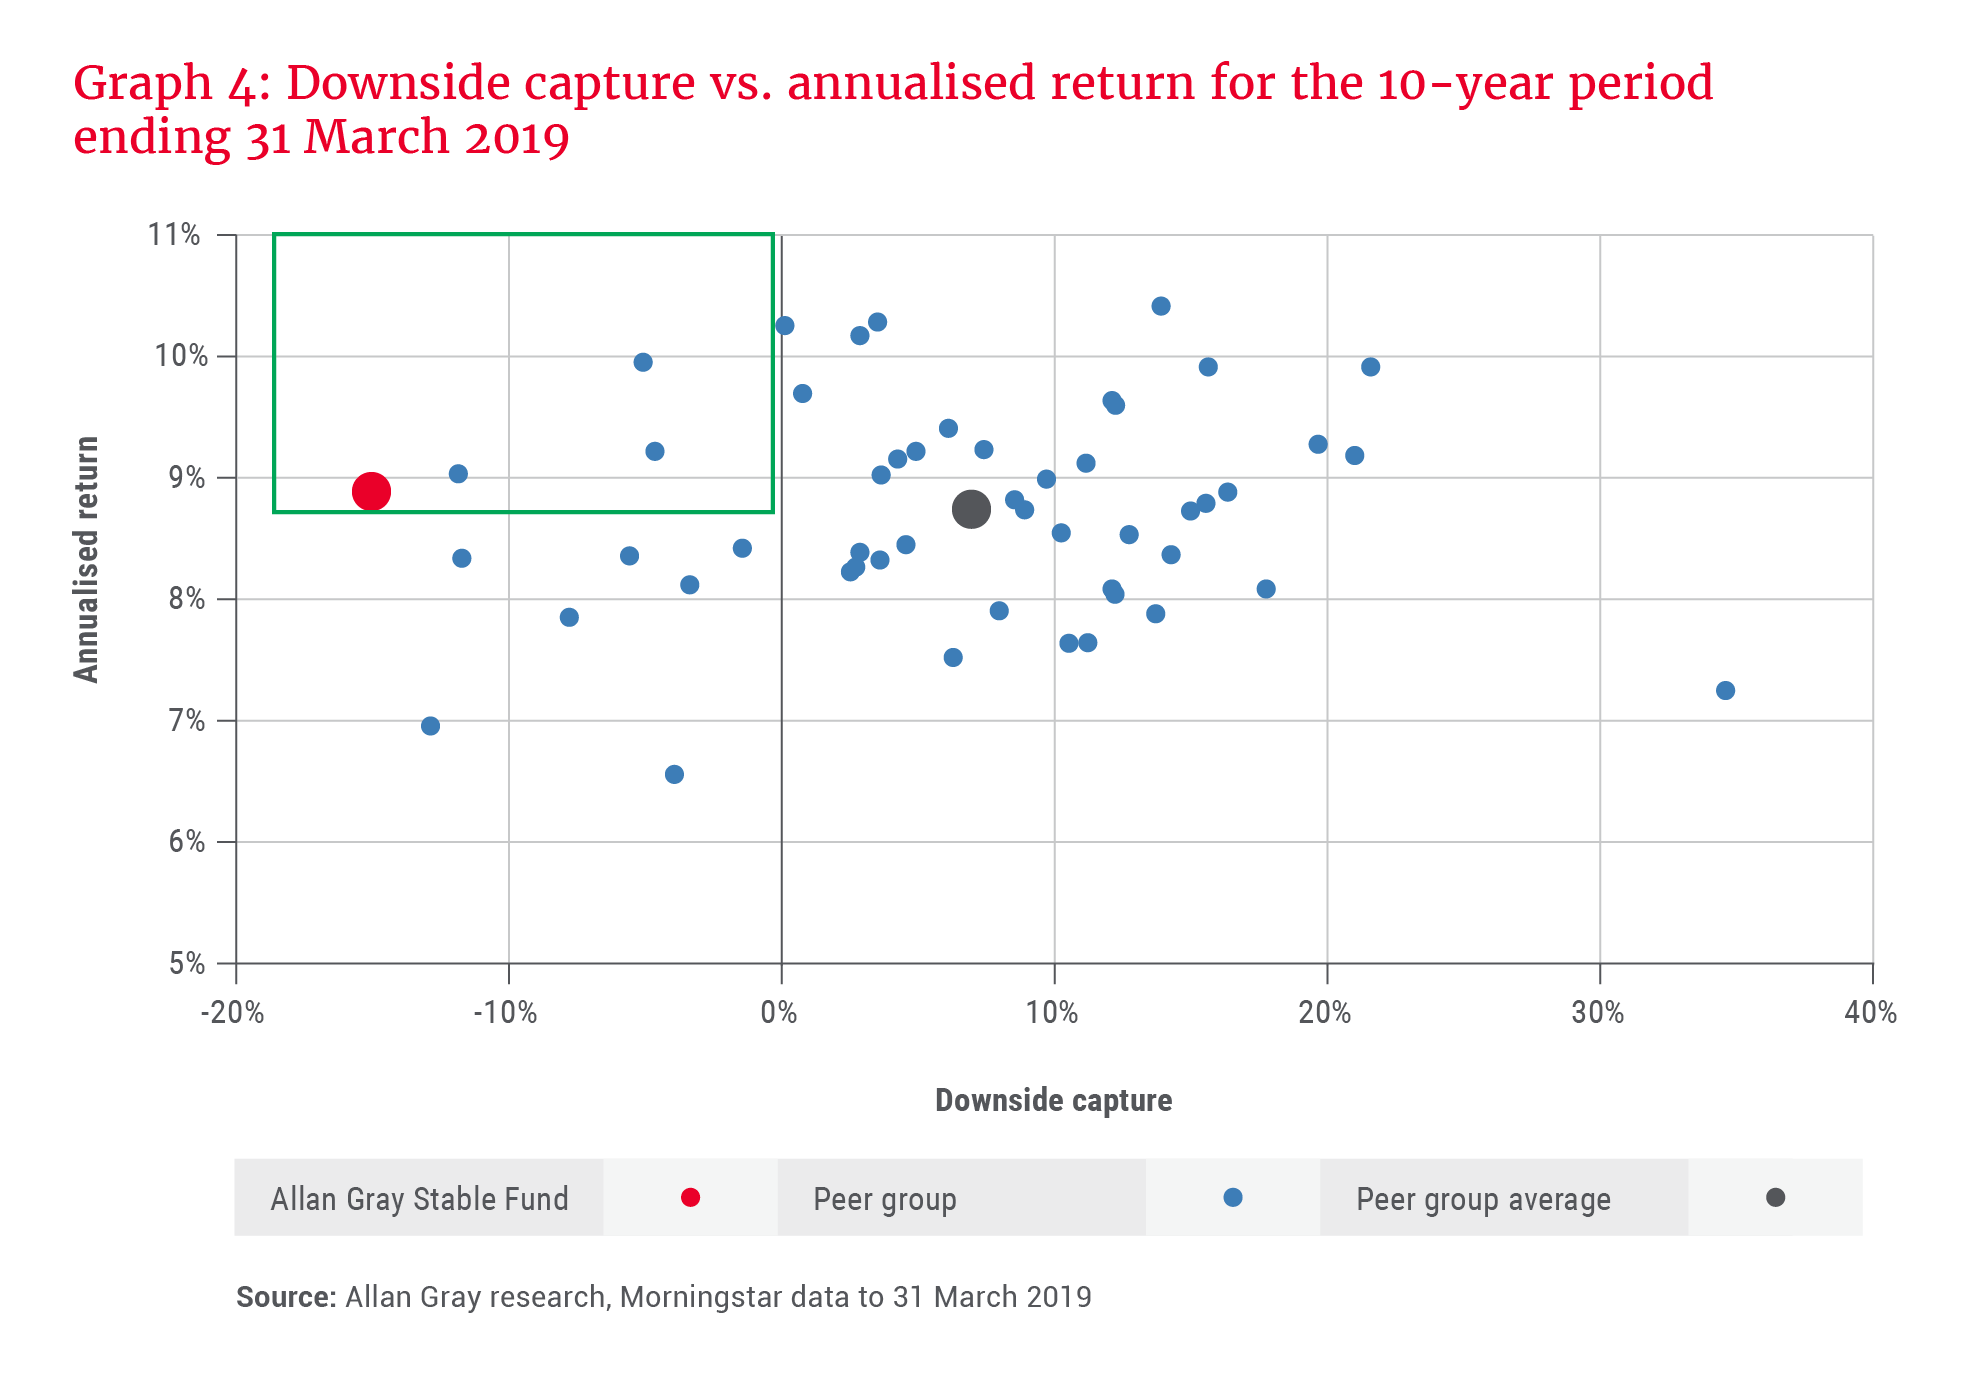
Graph 4 plots downside capture against the annualised return achieved over the period. This shows that the Stable Fund delivered an annualised return of 8.9%, slightly outperforming the peer group average of 8.7%. The returns over this period in the peer group range from 6.5% to 10.4%.
Importantly, the Fund never aimed to be a top-performing fund every year in its category, and we pay little attention to how our peers are positioned or to benchmarks. We believe that focusing on those metrics could undermine our approach and result in worse outcomes for our clients.
Yet, the Fund has still outperformed its benchmark and peers, and did so with significantly reduced risk and a lower equity exposure, illustrating the benefit of a bottom-up approach. This is uncommon. If you consider the green block on the graph, there are only a few funds that have managed to outperform in this way.
Most funds which have outperformed peers had above-average upside and downside captures, allowing for a greater short-term risk of capital loss. In hindsight, as the ALSI delivered an annualised return of 14% over the period, higher upside capture may have been desirable. Conversely, there are many funds that underperformed peers due to higher-than-average downside capture, which is an outcome that we guard against. The next 10 years may look considerably different, but we remain optimistic that our focus on the downside positions us well to navigate future investment environments.
How is the Fund positioned today?
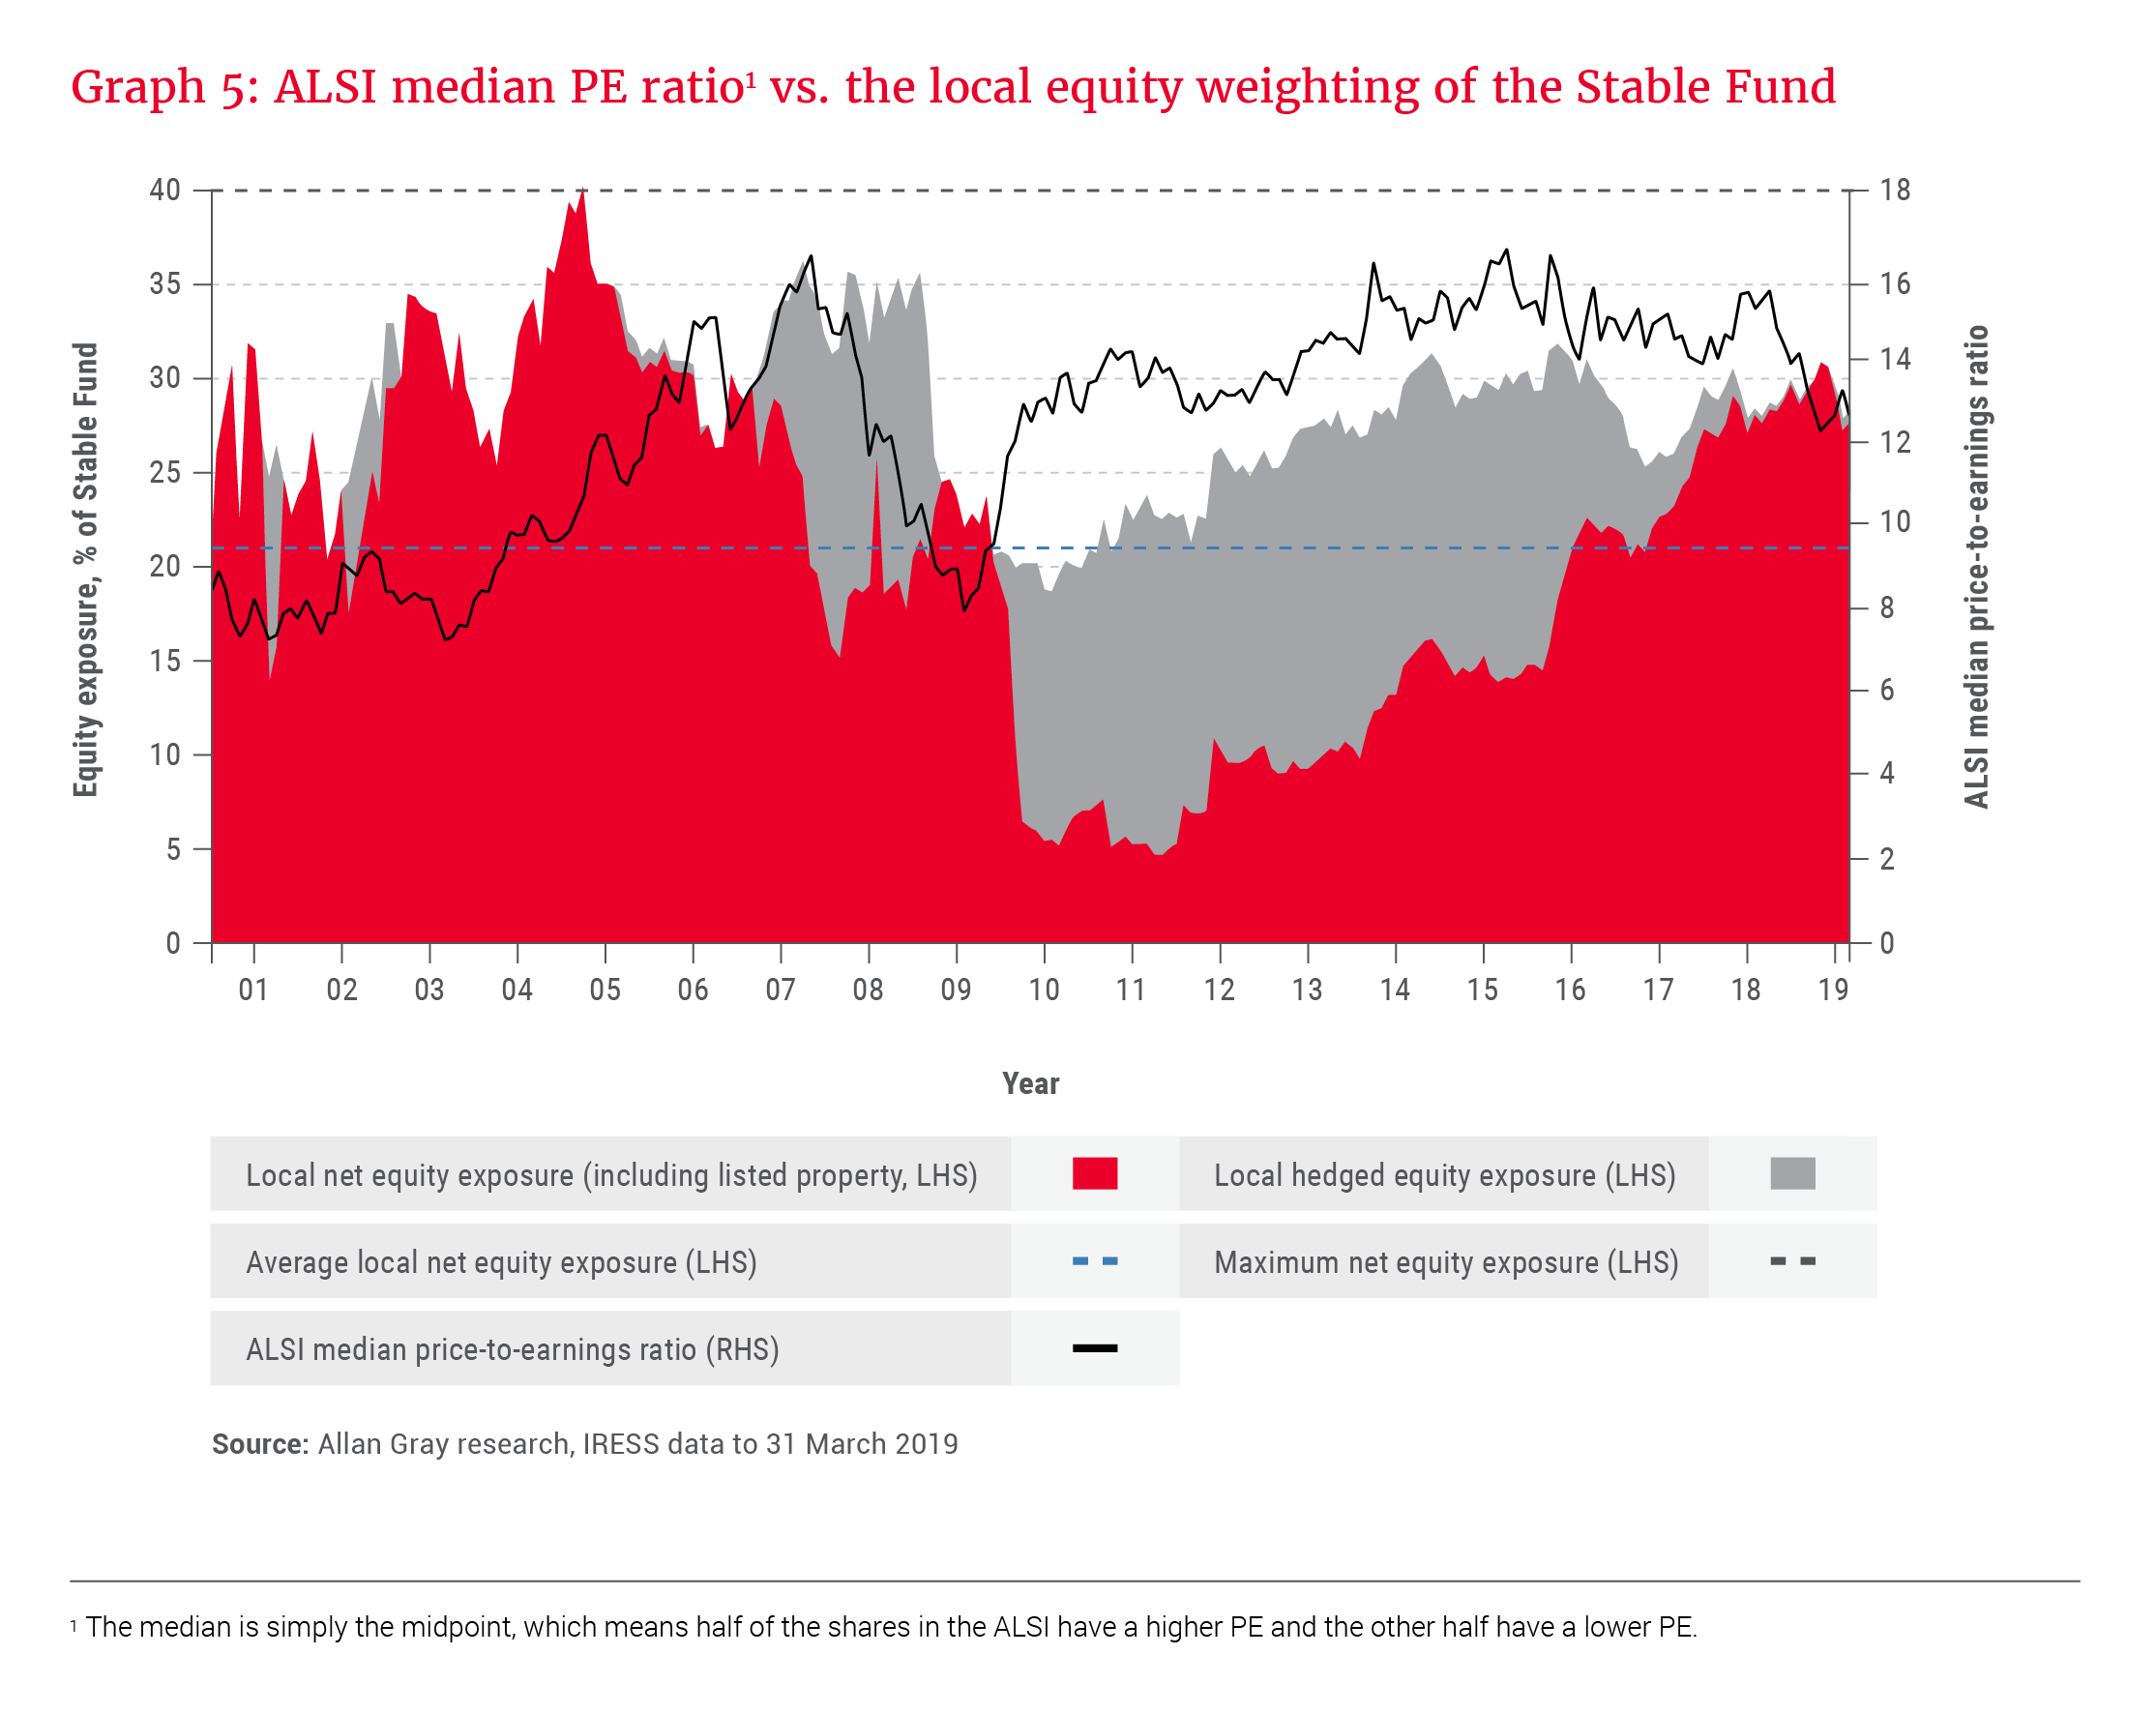
The Fund currently holds an above-average local net equity exposure relative to its history, as illustrated in Graph 5. This does not imply a change in the Fund’s mandate.
The Fund’s track record has been achieved through dynamic asset allocation and stock selection decisions over time, with equity exposure fluctuating as the market moves.
In addition, the share selection in the Stable Fund has historically been more conservative than those in our Balanced and Equity funds, given the objectives.
South African shares have performed no better than cash over the past five years – well below the average 8% per year historic outperformance. Similarly, emerging markets (including South Africa) have underperformed against developed markets and are out of favour with global money managers. It should therefore be no surprise that we are currently finding value in the local market. Graph 5 depicts the median price-to-earnings (PE) ratio of the constituents of the ALSI versus the local equity weighting. Unsurprisingly, as the median PE has declined, our equity weight has increased, and the hedged equity position has been reduced. Put differently, as the prices of our favoured shares move further below intrinsic value, the risk of permanent capital loss decreases and the benefit of being invested in equities subsequently increases.
Similarly, in terms of foreign investments, the Fund’s exposure is also higher than over its history. As foreign exchange control regulations were relaxed last year, we have been able to allocate a more sizeable portion of the Fund to offshore assets. This adds the benefit of further diversification to the portfolio as it expands the universe of assets we can include in the Fund. In addition, it can protect investors against potential rand weakness – a long-term risk, in our opinion, in light of the prevailing economic, political and social risks in South Africa. We are particularly excited about the opportunities identified in the Orbis SICAV Global Balanced Fund (as Alec Cutler discusses in Orbis: Hunting for value), which represents over 70% of the Stable Fund’s foreign exposure.
The portfolio managers of the Stable Fund think about the risks to the Fund as much as they do about prospective returns.
We recognise that a higher net equity weight and foreign exposure may increase short-term volatility, but believe that in the current environment, this positioning is still consistent with the Fund’s objectives. If we measure risk in terms of short-term return volatility, it may appear higher than in the past. However, measuring risk in terms of protecting your investment against long-term loss of purchasing power, it is quite the opposite in our view.
Achieving the objectives of the Stable Fund requires us to be mindful of both these risks, as we have done historically, and will continue to do.