
Several high-profile delistings over the recent past have spurred market commentators to discuss the JSE’s “slow death” in the context of a struggling local economy. Many view this as a sign of the times, arguing that investors should take their money and run. This narrative prompted Nadia van der Merwe and Stephan Bernard to unpack the trend. Is it fair to extrapolate the recent delistings uptick? Are things as bad as they seem, or is the JSE an attractive investment destination? A deeper dive reveals several forces at play.
The JSE was established during the Witwatersrand Gold Rush. Strong demand for capital, coupled with a simple, cheap, and permissive listings process resulted in its initial rapid growth, with over 300 companies listing within three years.
The JSE played a massively important role in South Africa’s development as a market of financiers and miners – facilitating the expansion of the mining industry into a cornerstone of modern South Africa. The mining sector would continue to dominate the exchange for decades to come. Over time, structural changes in the economy resulted in the market composition changing as the secondary and tertiary sectors of the economy expanded.
Public equity gives investors access to investment opportunities within a regulated environment, typically with greater accessibility and opportunity for diversification relative to private equity. It also creates liquidity through a secondary market which, if sufficient, gives investors confidence in their ability to sell. On the other side of the equation, it offers growing businesses the opportunity to raise capital.
The JSE continues to play these important roles in South Africa today. Local investors, especially those constrained by foreign investment limits such as retirement funds, can access a reasonably wide range of investments across asset classes in an efficient manner. Private equity (including venture capital) is still small and the JSE remains the main facilitator of large-scale funding to businesses. It is also well positioned to support much-needed infrastructure development through its funding mechanism.
Unpacking the delistings trend
The number of companies listed on the JSE has decreased from 776 to 331 over the past 30 years, with over 14 companies delisting every year on a net average basis. The nature of markets is to reward success and eliminate what is not sustainable. As such, companies list and delist from exchanges as the business life cycle plays out. There is cause for concern when a net delistings trend emerges over time. This could be symptomatic of a faltering economy and persistent negative business sentiment, but there are a number of other factors to consider. It is important to drill a bit deeper to understand the drivers of the trend.
Structural and cyclical factors
South Africa’s challenges are well known and there is concern that the current delistings trend is a structural one reflecting the state of the struggling local economy. Indeed, markets with high new listings activity typically have supportive economic growth and accommodating policy.
However, there is a cyclical element too, driven by sentiment, as well as the relative attractiveness of raising capital through equity or debt, where the level of interest rates plays a role. Broadly speaking, the number of initial public offerings (IPOs) typically increases during late-stage bull markets. When sentiment is elevated, investors are willing to pay higher prices and there is more capital searching for promising opportunities.
This is a global phenomenon. For example, the number of US listings has been decreasing steadily over time, with bouts of new listings correlated to market performance. Recent strong returns in the technology sector have spurred 28 new technology-related IPOs in the US so far this year. The healthcare space has been similarly active. The amount of capital raised from IPOs in the US during 2020 was more than three times the average over the prior 17 years. This continued into 2021, with total funds raised in the first quarter not far behind the total raised for the entire 2020.
Similarly, delistings typically increase when sentiment is poor (making companies attractive takeover targets) or when challenging economic conditions highlight companies’ unsustainable fundamentals (and businesses fail). This is particularly pronounced following market crashes, when delistings are typically plentiful. A plot of global delistings reveals two major peaks over the past 30 years: one after the 1998 emerging markets crisis and the end of the dotcom bubble, and another following the global financial crisis (GFC) of 2007/2008.
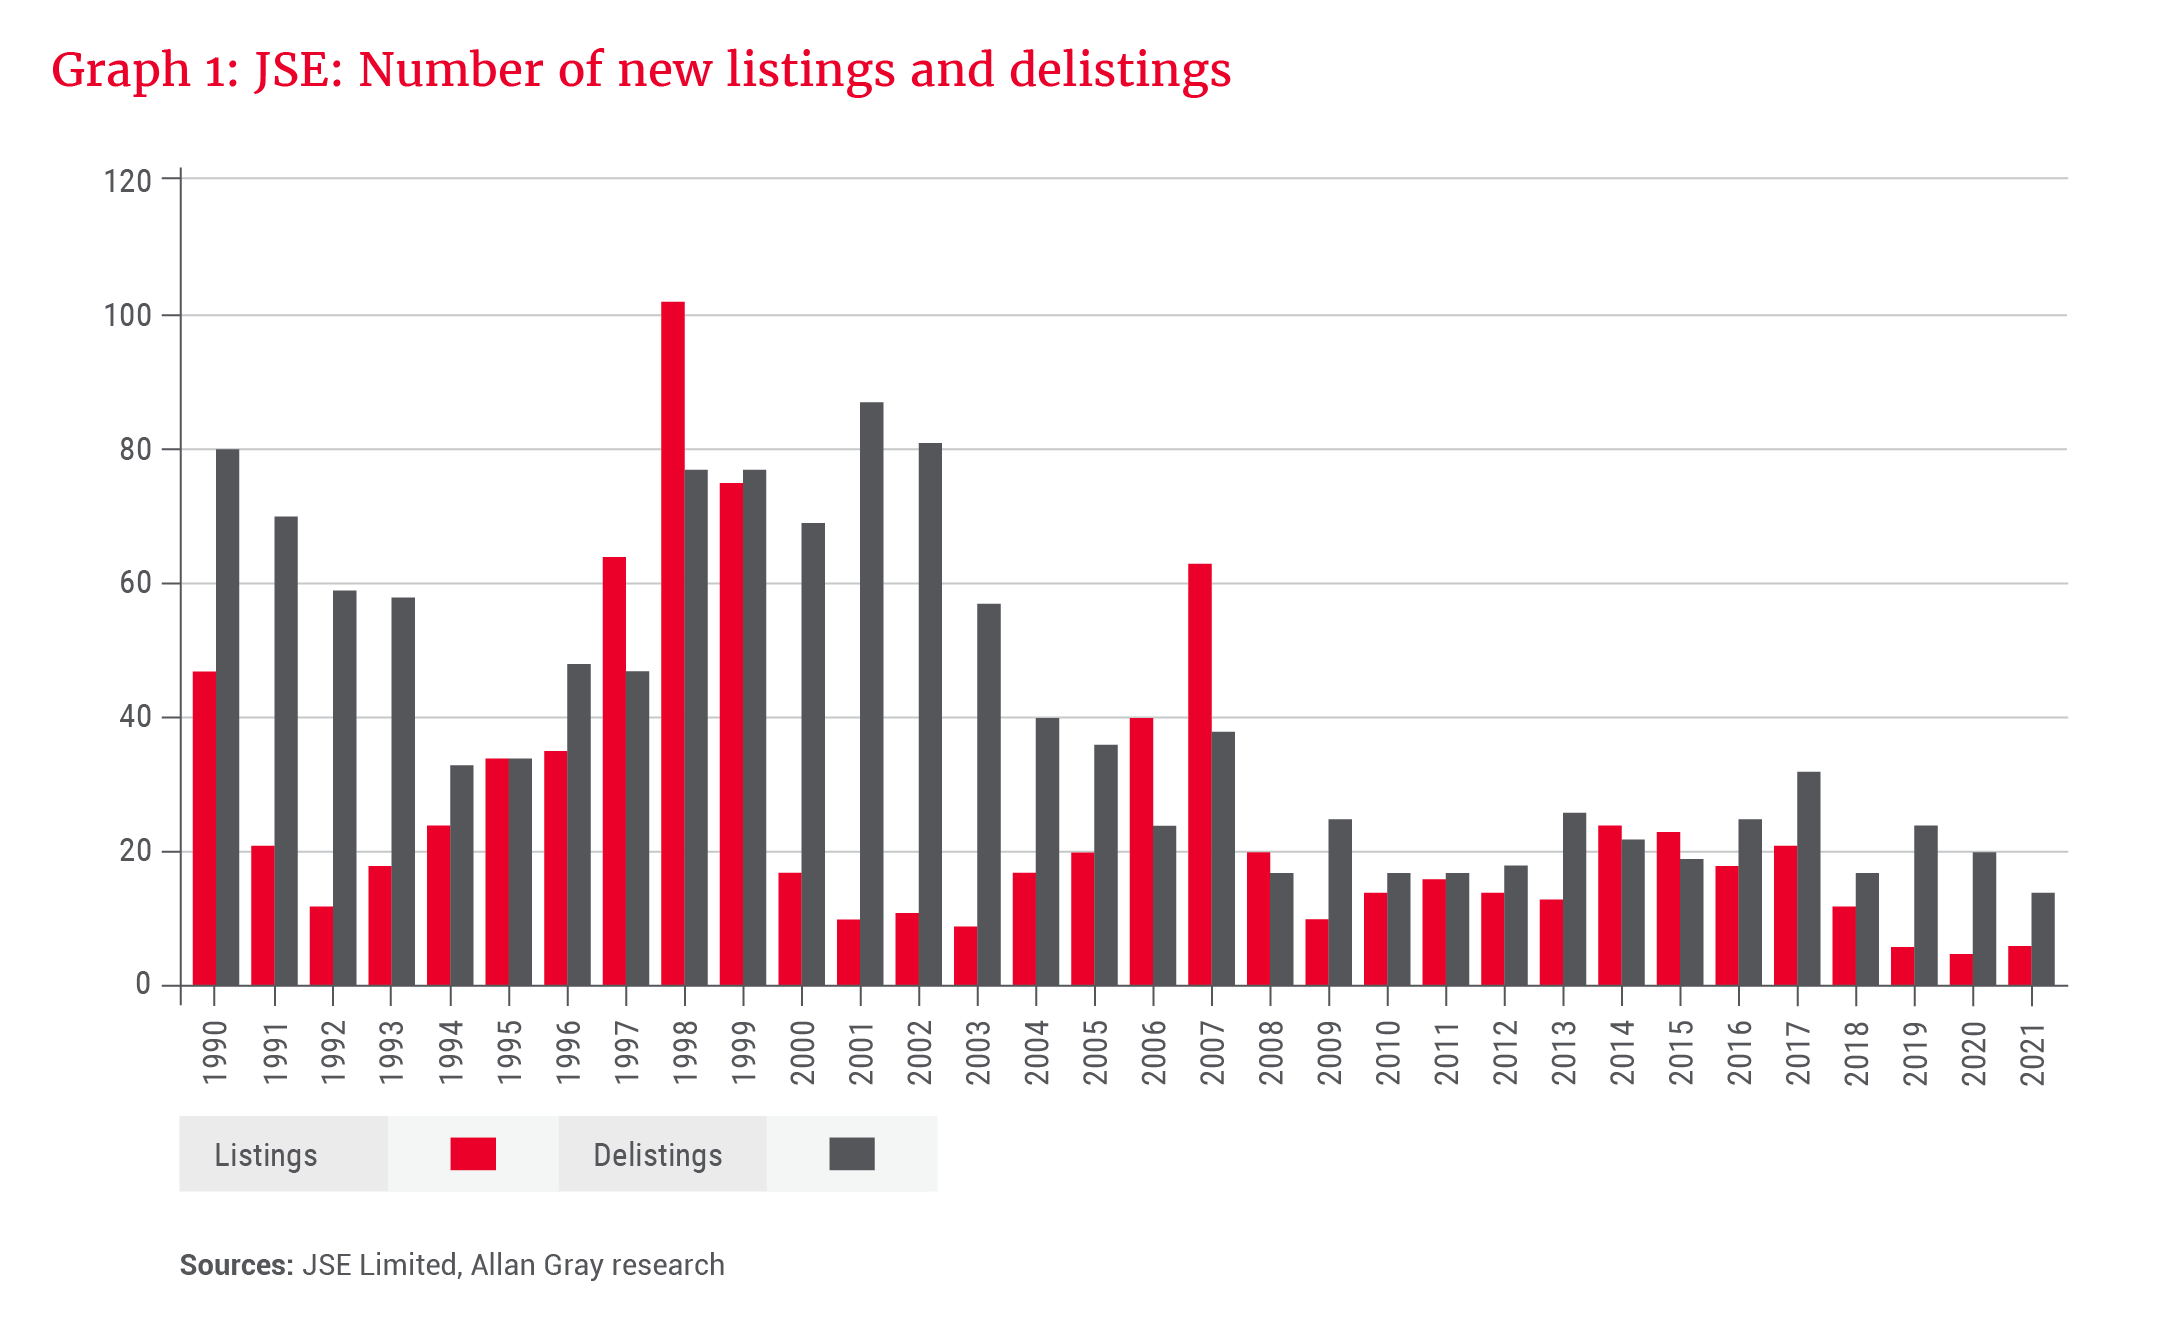
In the South African market, the cyclicality of new listings over time evidently follows market levels, as shown by the red bars in Graph 1. Previous peaks occurred at the height of the tech bubble and prior to the GFC. During market weakness, the opposite is generally true – there are fewer new listings. Considering the total number of listings on the JSE, much of the decline over the last 20 years occurred during the early 2000s, driven by a high number of delistings combined with few new companies coming to market. Following the tech crash, sentiment was severely depressed, and many companies struggled. Some of them failed, several were taken over. The number of listings subsequently stabilised and remained broadly constant from 2004 to 2016. Since then, fewer new companies have come to market, while delistings remain at broadly similar levels.
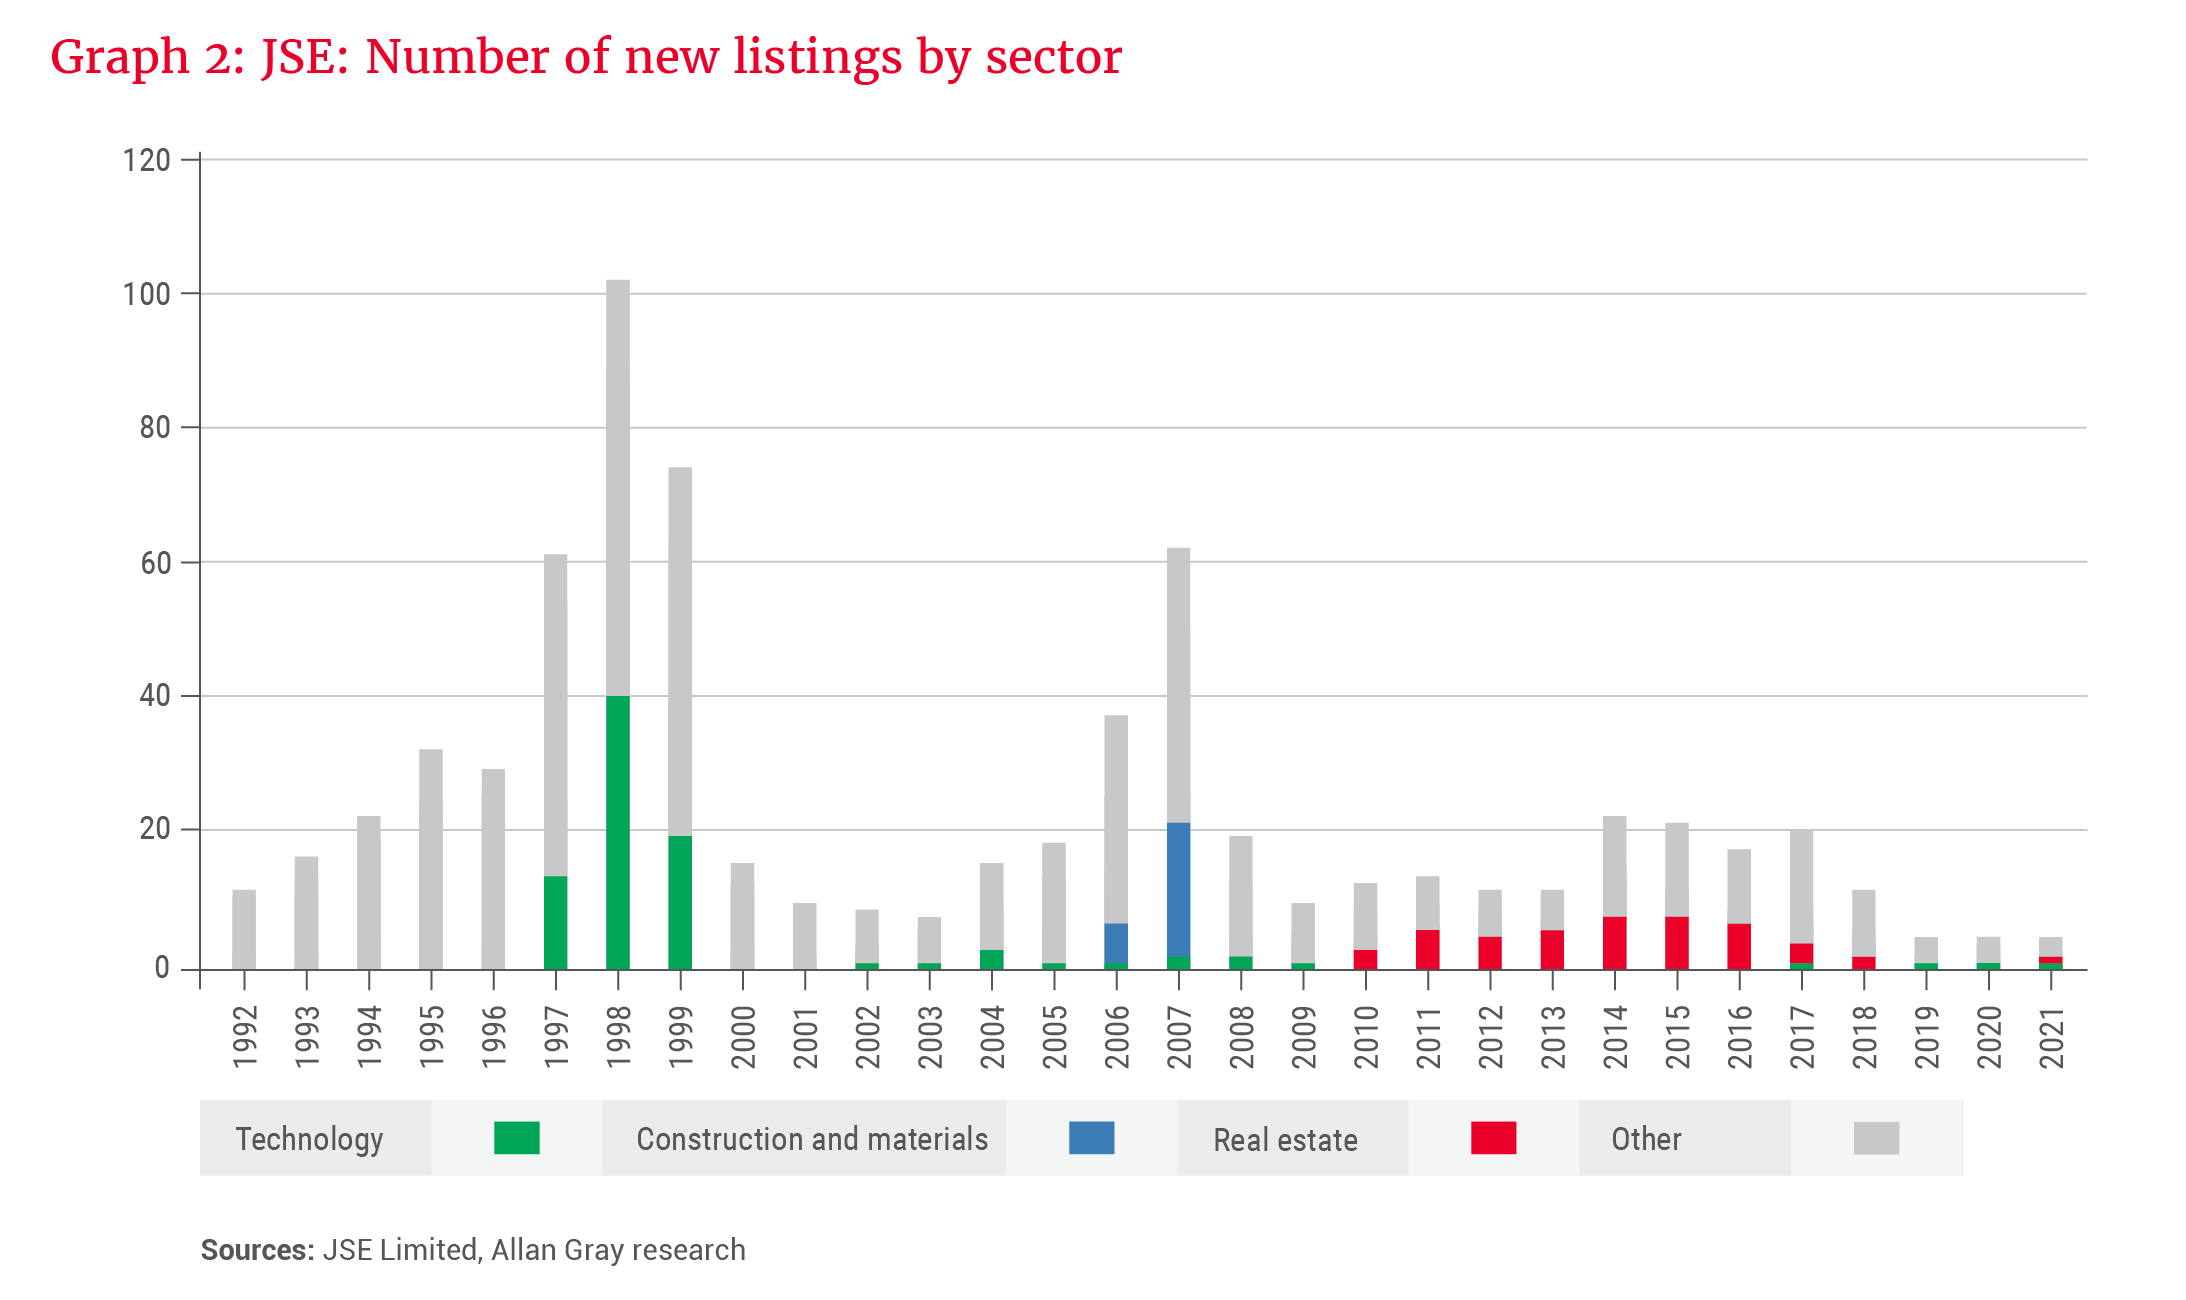
A sectoral split of new listings over time confirms the sentiment-driven nature of listings’ cyclicality, as shown in Graph 2. Over the past 30 years, we have experienced three major cycles of new listings, each driven by a specific sector. While elevated markets should generally boost listings across sectors, there are often specific sectors characterised by conspicuous optimism. It is unsurprising that in the late 1990s, at the height of the tech boom, technology companies comprised a significant portion of new listings. During 2006 and 2007, in the build-up to South Africa hosting the 2010 FIFA World Cup, it was the construction sector. For most of the 2010s – the glory days of listed property – real estate listings were plentiful.
Consolidation of companies into larger listed corporations
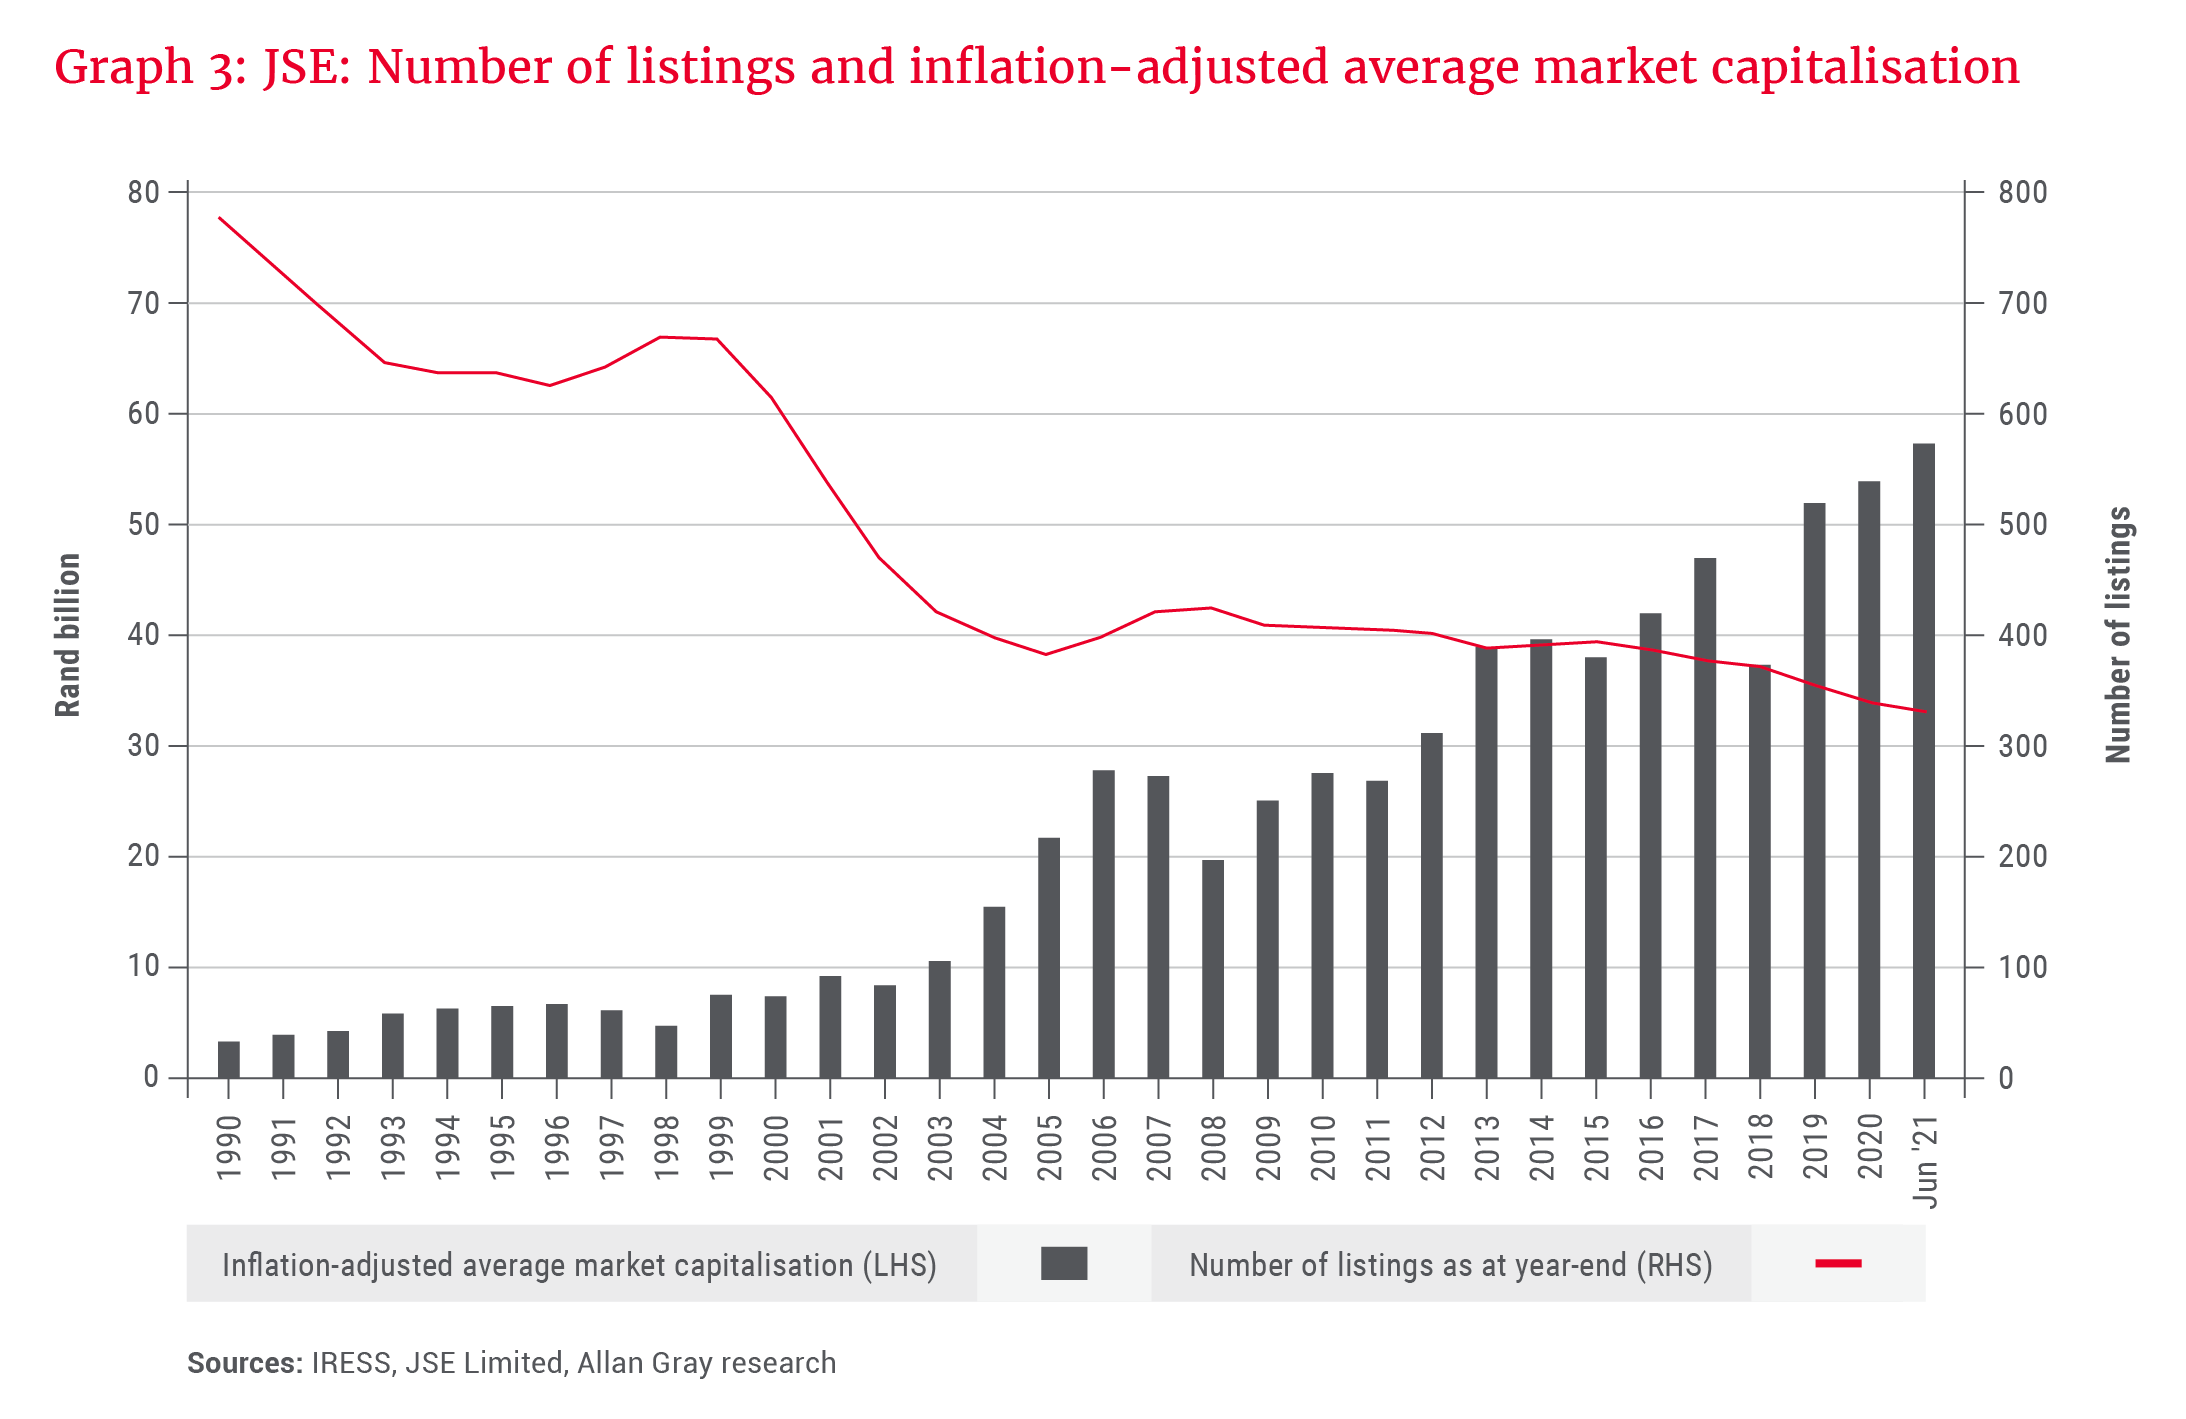
There is consolidation of companies into larger listed corporations. This is a long-term global trend seen in the US, UK, Germany and other major markets, which is in line with what we see on the JSE. Graph 3 contrasts the number of JSE-listed companies with the inflation-adjusted average market capitalisation per listing: The number of listings may have declined, but the average listed company is significantly larger today than it was 10, 20 or 30 years ago, even after adjusting for inflation. The total market capitalisation has increased significantly over time, and it is fair to say that the decreasing number of listings does not necessarily signify a weaker market.
it is fair to say that the decreasing number of listings does not necessarily signify a weaker market
To illustrate the consolidation point, in 1982, there were 93 companies listed in the mining sector, 45 of which were individually listed gold mines. Today, we have only seven locally listed gold miners – all owners of a portfolio of mines.
Smaller companies delisting
The downward trend in the number of company listings over the past decade is mostly a result of delistings among small businesses that fall outside the acceptable size and liquidity range of the average asset manager. During 2020, there were 19 company delistings, 16 of which were smaller than mid-cap. In 2021 to date, there have been 11 company delistings, with 10 smaller than mid-cap. Although the number of delistings has exceeded that of new listings since 2016, the market capitalisation of new listings has exceeded that of delistings every year since as far back as 2008.
The number of companies with market capitalisations above R5bn (in 2021 rand value) has increased over time – from 83 in 2000 to 113 in 2010, and 121 in 2021. This suggests that the investment universe for larger investors has actually expanded over time. Drilling down one further layer, it is interesting to note that many of the more prominent delistings of recent years have been for reasons that suggest value and confidence in future returns, rather than because of businesses failing. Delistings include Clover, Pioneer Foods, Assore and Comair. All but Comair were takeovers or management buyouts, indicative of the attractive levels at which many of the shares on our market trade. News that Heineken is considering the acquisition of Distell and Standard Bank's intent to buy out Liberty are further supporting examples.
Companies staying private for longer
Globally it appears that companies are staying private for longer, partly driven by the growing availability of private equity, which offers an alternative source of funding. For example, Airbnb raised US$5.4bn in private funding to grow the business ahead of its US$3.5bn IPO in 2020. It was valued at over US$86bn after its first day of trade – a sizeable business for a new listing.
The greater availability of private capital could mean that companies that would otherwise have listed for funding fail before they reach that point. The other observation is the tendency of some large growth companies, such as Naspers and Amazon, to have a portfolio of “start-up” ventures. In this manner, these companies are providers of early-stage funding, with the potential of spinning off successful businesses as they reach scale.
Another factor driving delayed listing is the increased compliance cost and growing regulatory burden associated with doing so in a post-GFC world. In South Africa, the private equity market is still small, but a heavy regulatory burden is a listings deterrent – and a driver of delistings. This impacts especially smaller players, and has been evident in our engagements with them. Having an accessible, effectively regulated exchange is key to South Africa’s continued development. However, a fine balance must be struck in terms of regulation, such that requirements are not overly burdensome or costly.
Market composition has changed
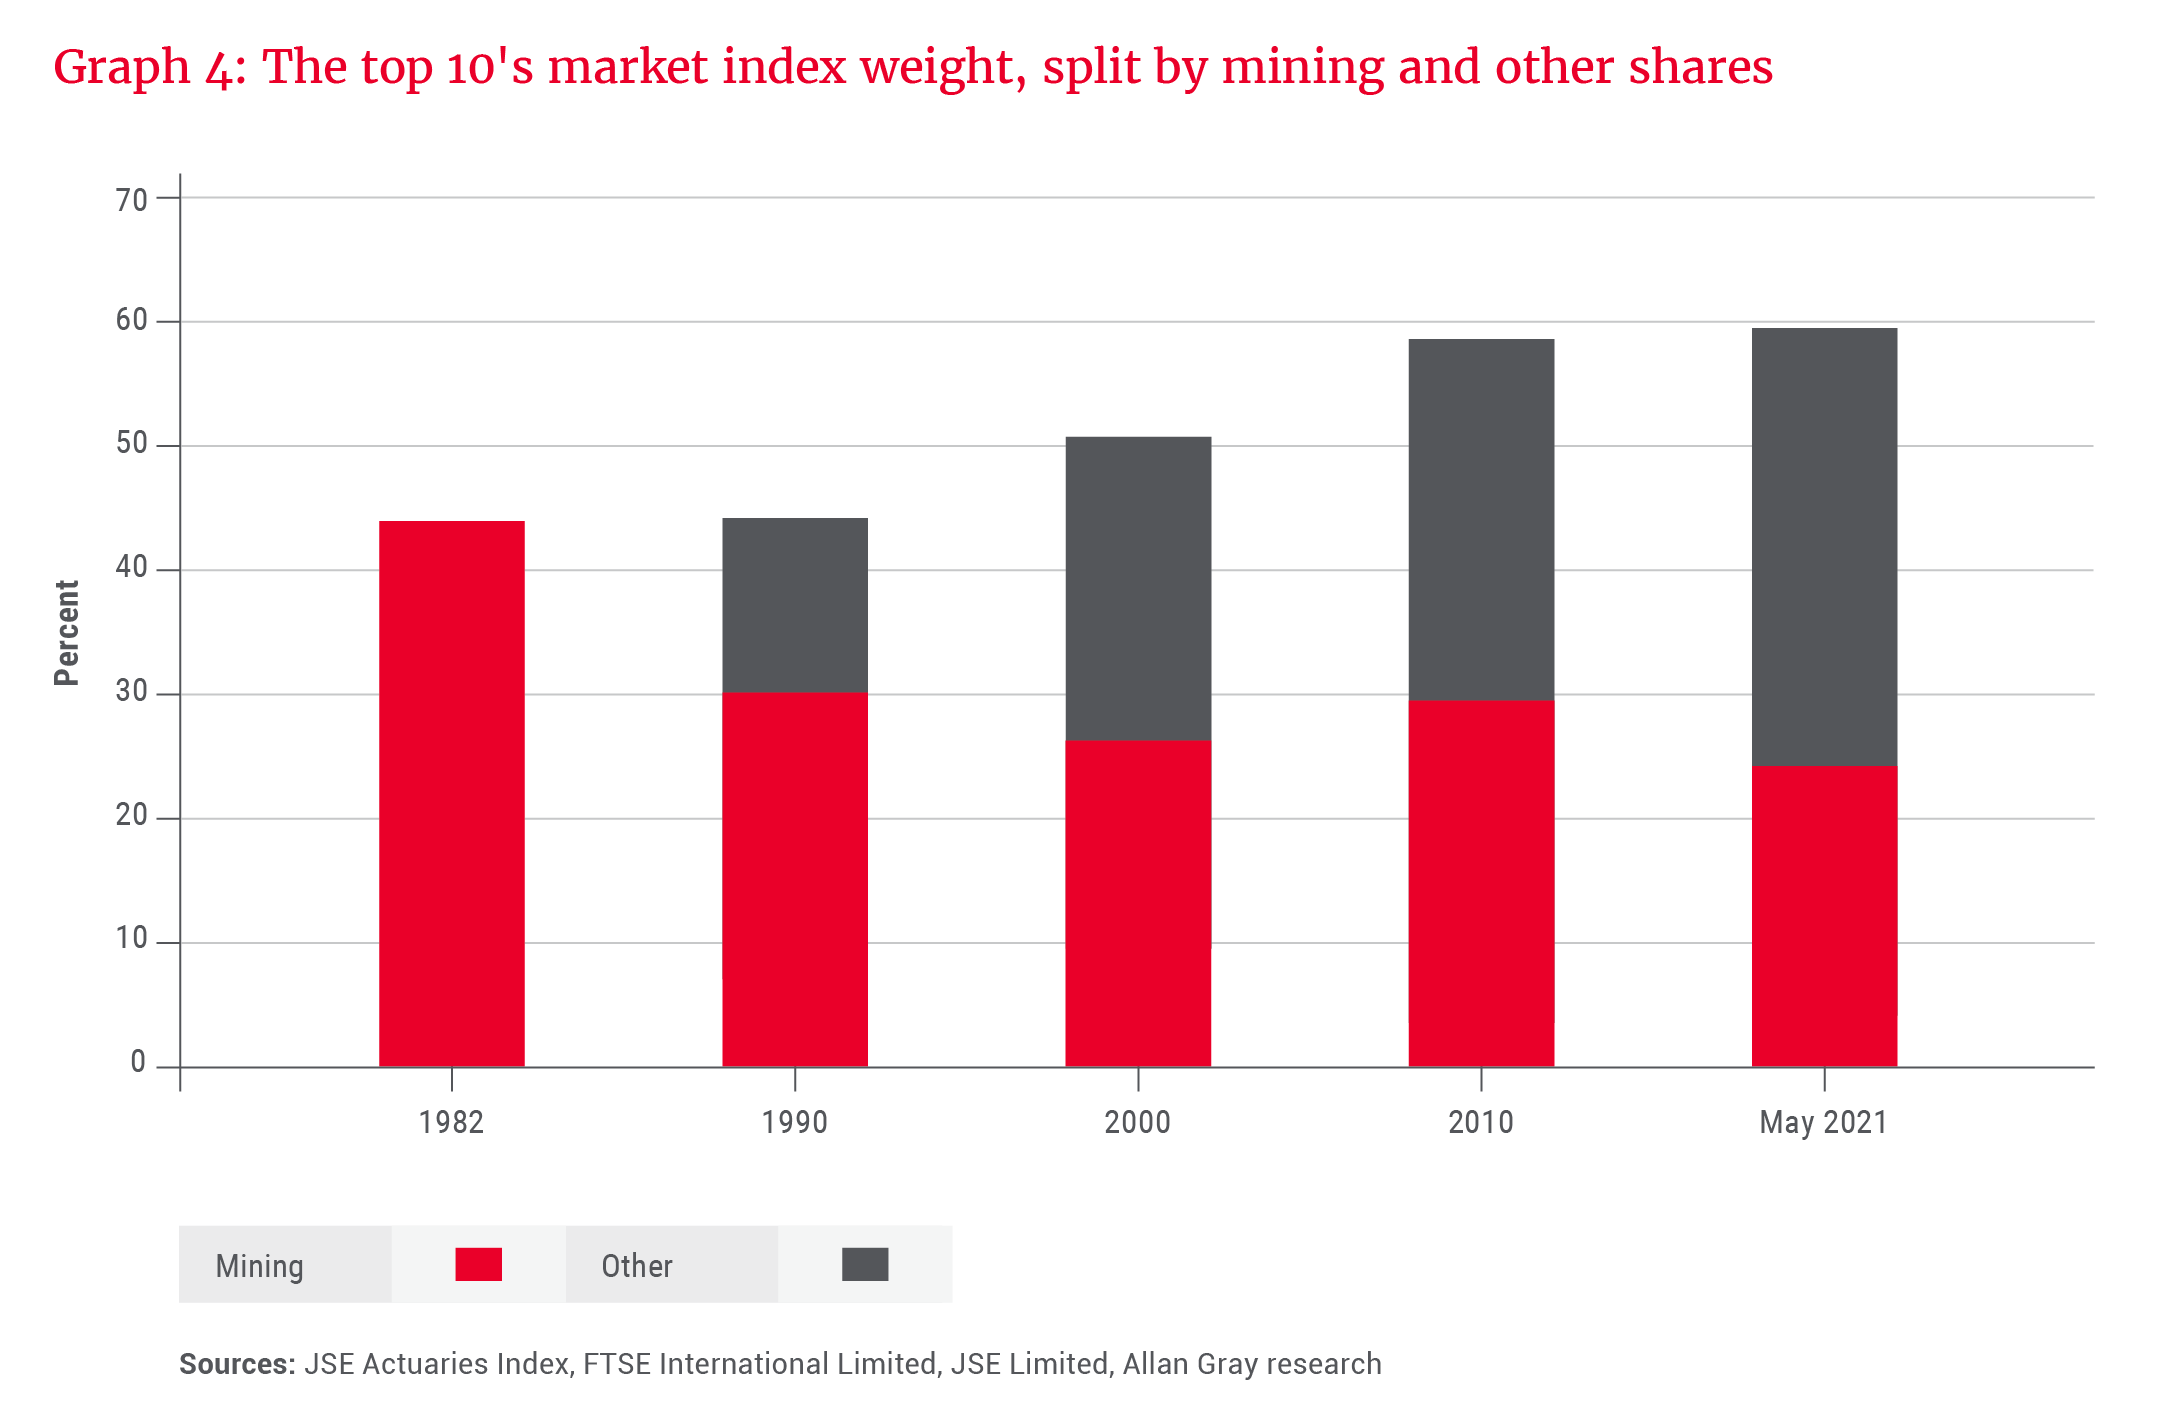
The concentrated nature of the JSE is often cited as a concern. We recognise this as a challenge, but this is not a new issue – it has been true for the past 40 years (the full history for which we have data). Graph 4 illustrates the change over time. In December 1982, the top 10 shares comprised 44% of the market index. Concentration has increased since then – as has been the case across most major markets – with the top 10 currently comprising 60% of the FTSE/JSE All Share Index (ALSI), but the sectoral composition has become markedly more diversified. In 1982, mining shares represented the entire top 10 (and two-thirds of the full index), and today represent 41% of the top 10 (one-third of the full index). The current figure arguably overstates mining’s through-the-cycle weight owing to the strong rally in commodity prices since the beginning of 2020.
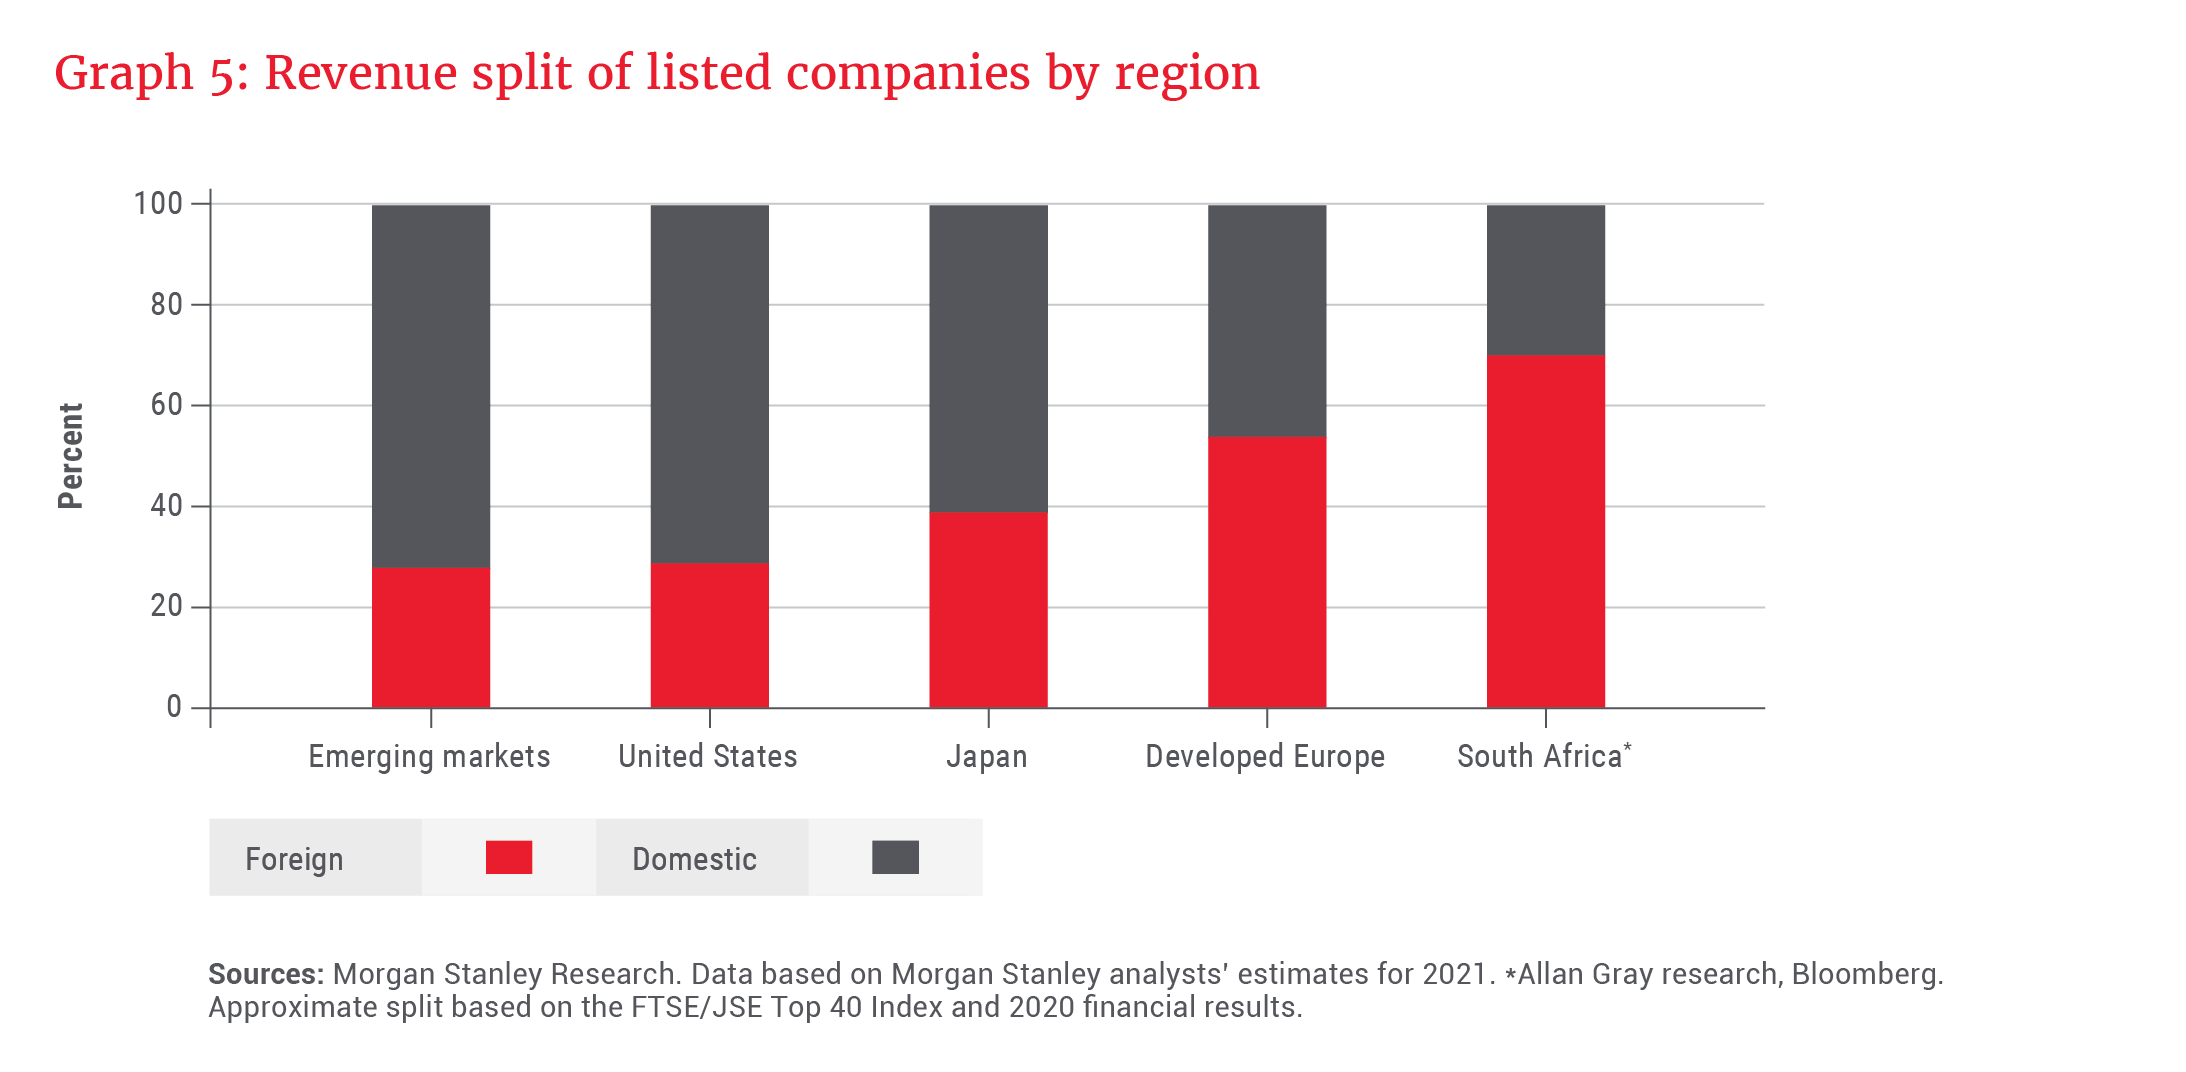
In addition, the consolidation trend discussed earlier has resulted in companies that are very different. Today’s top 10 counters represent far more diversified businesses than was the case in the early 1980s, when many were individually listed mines. For example, Naspers is a single counter, but gives investors exposure to a vast portfolio of new economy ventures, most of which are based outside South Africa. Several listings offer exposure to international opportunities. These include companies like AB InBev and British American Tobacco, which may be listed on the JSE, but have very little exposure to the South African economy. In fact, foreign revenue comprises approximately 70% of the total generated by JSE-listed companies. This means that the JSE is much less domestically focused than most other exchanges, as illustrated in Graph 5, and therefore not as exposed to South Africa’s economic woes as one might expect.
How this reflects in your portfolios
We cannot ignore the impact of South Africa’s macroeconomic challenges on the listed equity market. Without efforts to address these, it will be difficult to significantly grow the breadth and depth of the market. However, notwithstanding the challenges, the JSE remains one of the world’s 20 largest exchanges by market capitalisation. Many of our market’s challenges are not new, yet South Africa has been a great place to invest over the very long term.
We remain confident in our ability to construct diversified portfolios given the size of our opportunity set, the composition of the market, and the nature of the underlying businesses
We remain confident in our ability to construct diversified portfolios given the size of our opportunity set, the composition of the market, and the nature of the underlying businesses. Based on our fundamental research, we are finding many attractive opportunities, and this is reflected in the positioning of our clients’ portfolios: The local net equity weighting in the Allan Gray Balanced Fund is close to the highest it has been in a decade.
Prominent recent delistings seem to support the view that local shares are trading on attractive valuations. We think there is upside from here. And should sentiment turn, we may well see a reversal in the delistings trend too.