Regular readers of our Quarterly Commentary will know that at Allan Gray we are focused on generating superior returns for our clients over the long term. One way to evaluate whether or not we are delivering on this goal, is to consider the total return our funds have generated (also known as the absolute return). Another way to evaluate our performance, is to look at how our funds have performed relative to their benchmarks. Using the Allan Gray Balanced Fund (Balanced Fund) as an example, Fiona Jeffery explains how it can be useful to drill a bit deeper into the composition of a fund to understand contributors to and detractors from performance (also known as an 'attribution analysis').
Understanding the benchmark
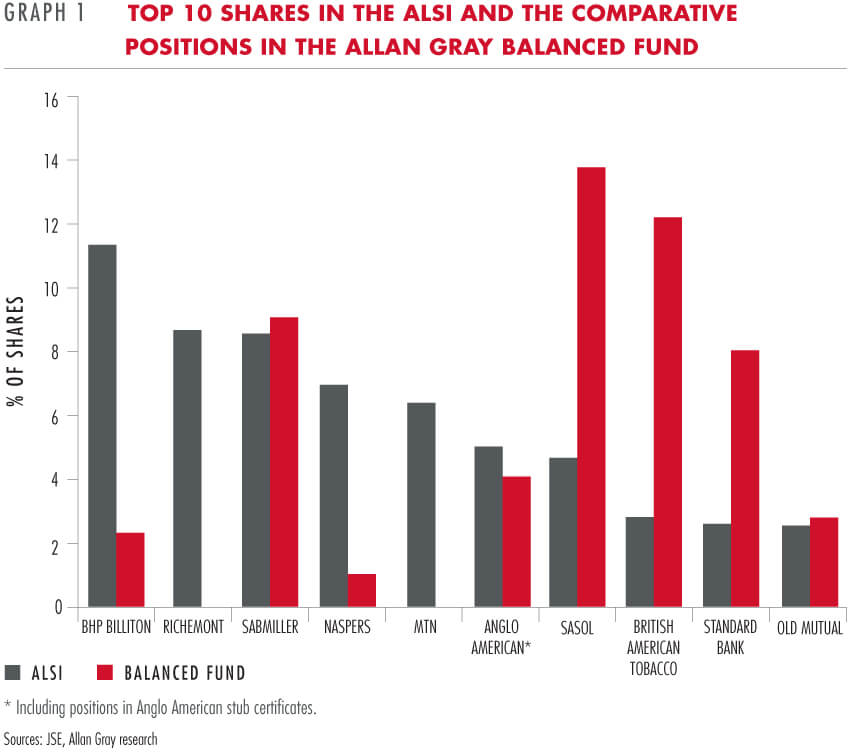
While we use benchmarks to assess performance, the composition of the benchmark plays no role in the positioning of most of our funds. Our portfolio managers use a bottom-up approach to selecting shares, looking for companies they believe are priced below their fair value. They are not constrained by the benchmark. This is illustrated in Graph 1, which shows that there are several large shares in the FTSE/JSE All Share Index (ALSI) which we either do not hold in the equity component of the Balanced Fund, or hold to a much smaller degree. For example, Richemont is the second biggest share in the index but it is not included in the Balanced Fund. This does not mean our portfolio managers and analysts do not spend time researching and thinking about stocks like Richemont – they do. Including or excluding a share is a considered decision, which will have an impact on relative performance. This is important in the context of our local market, as a few large stocks make up a big portion of the ALSI.
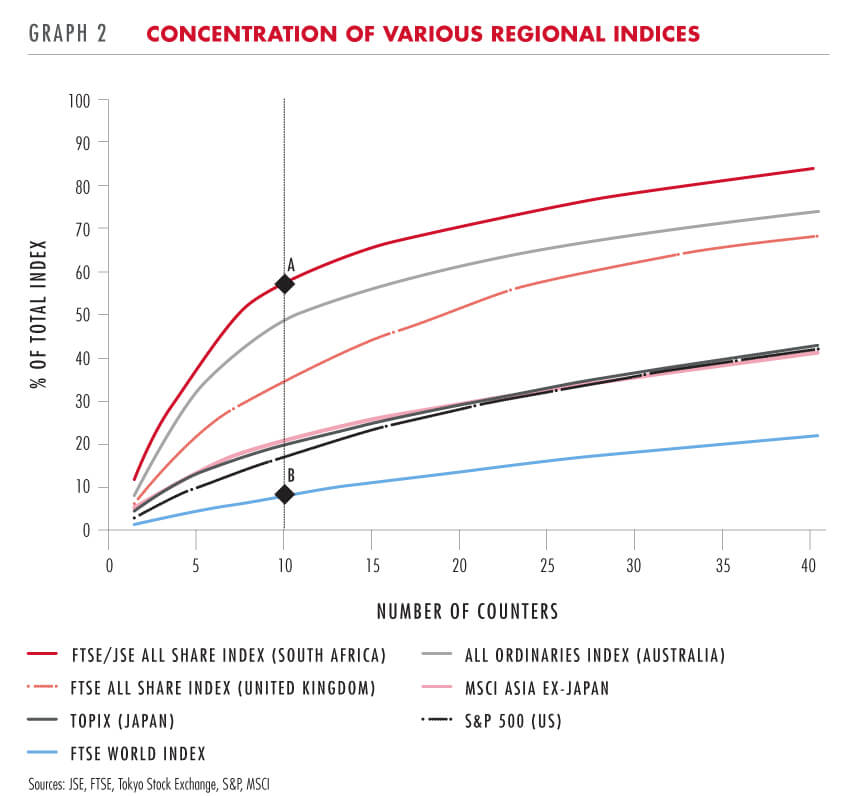
To illustrate this point further, Graph 2 shows that our local index is fairly concentrated compared with larger country and global indices. Each line represents a different index and shows the cumulative weight of the largest counters in the index (starting at one and ending at 40). For example, the top 10 shares of the ALSI (illustrated in Graph 1) represent almost 60% of the total index (point A in Graph 2). However, at point B, the largest 10 constituents of the FTSE World Index represent just over 8% of the total index. It is not surprising that a small regional index such as the ALSI is more concentrated than a global index like the World Index, which has many more constituents. When comparing these indices it becomes evident that a global manager has a much larger group of shares to choose from than we do. The returns of the individual constituents of the benchmark therefore are an important aspect in understanding the drivers of performance for our market. Likewise, the benchmark is useful in evaluating our returns (as part of an attribution analysis) as relative performance is shaped just as much by the shares we don't hold, as by the shares we do on behalf of our clients.
Attribution of the Allan Gray Balanced Fund
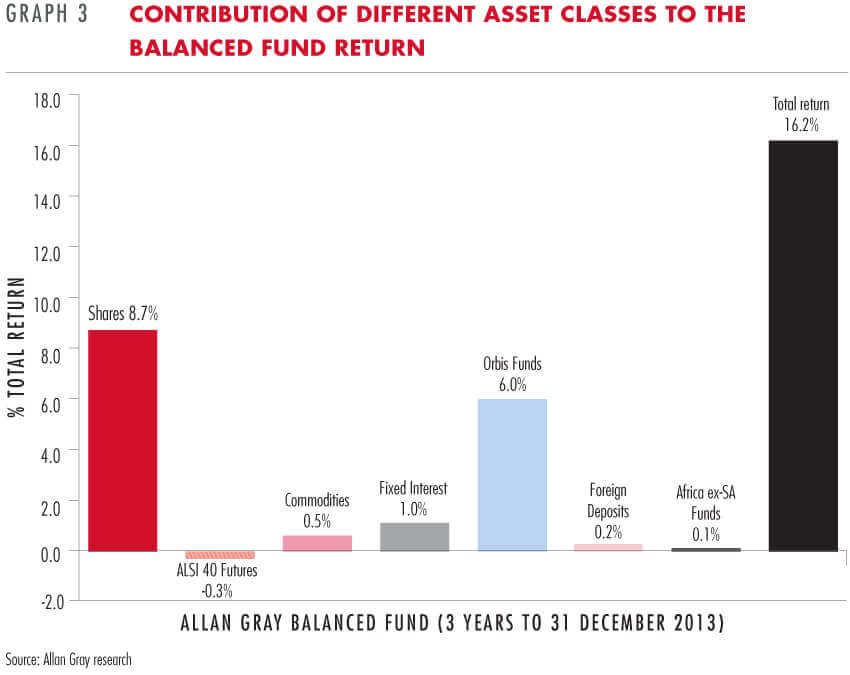
There are different ways of analysing the return of the Allan Gray Balanced Fund over the most recent three-year period. Graph 3 allows us to see how various components contributed to the return of 16.2% p.a. over the period. It is evident that the biggest source of returns has been the South African shares in the Fund (red area), contributing 8.7% p.a. out of the total return. By investigating these share returns further, we are able to see the underlying drivers of this return in more detail (see Graphs 4 and 5).
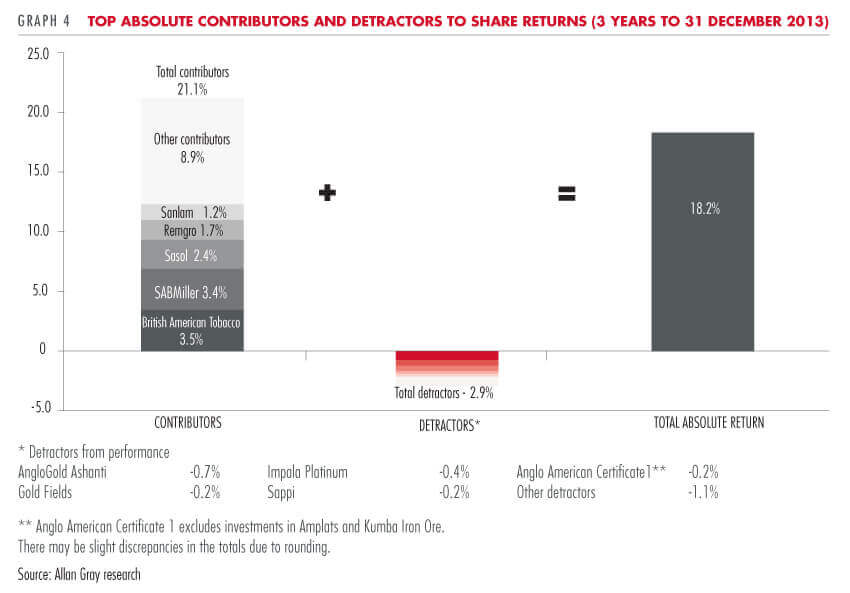
An absolute share attribution is useful because it tells us simply if the shares we invested in contributed to or detracted from returns. Graph 4 provides further insight, indicating which shares had the largest effect on total share returns. For example, the position in British American Tobacco was the biggest contributor (adding 3.5% p.a. to share returns) over the period and the position in AngloGold Ashanti was the biggest detractor (0.7% p.a.). After adding up all the shares which contributed to performance and all the shares which detracted from performance, the total absolute unweighted return from SA shares held by the Balanced Fund was 18.2%.
It is also useful to see how our selection of shares performed compared with an equity index like the ALSI. Graph 5 shows us that the shares in the Balanced Fund returned 1.8% more per year than the ALSI over the last three years. A relative share attribution illustrates how our selection of shares performed when compared with the index to produce that outperformance. The results mostly depend on whether a share makes up a smaller or greater percentage of the equities in the Fund (i.e. whether it is an underweight or overweight position) compared to the ALSI, and how that share performed relative to the ALSI. We have split the shares into four different categories for the purposes of explaining relative returns: over- and underweight contributors, which add to relative performance over a given period, and over- and underweight detractors, which reduce relative performance.
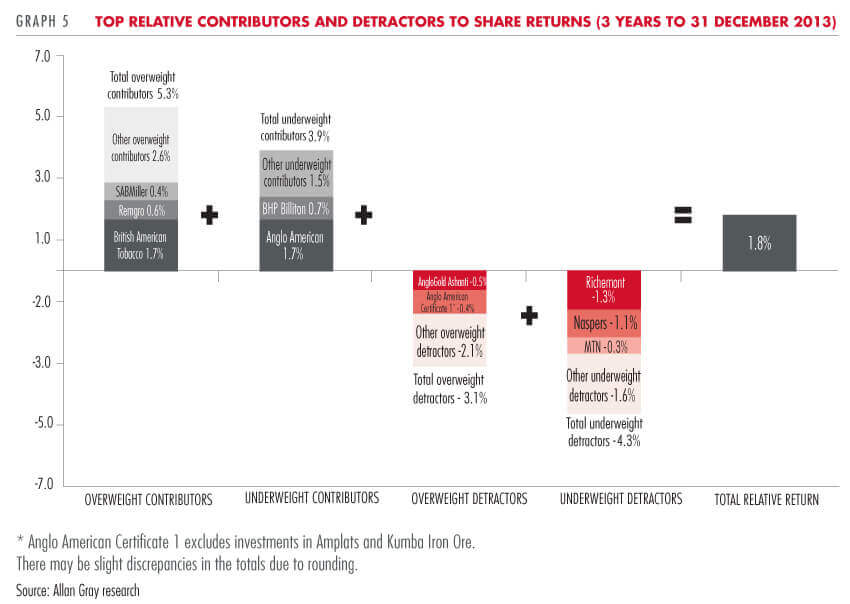
Over the period, British American Tobacco was also an overweight contributor – a share which outperformed the ALSI and in which the Fund held an overweight position. Anglo American was an underweight contributor, i.e we held an underweight position in an underperforming stock. AngloGold Ashanti was an example of an overweight position which underperformed the index. Graph 5 also indicates that our most recent relative performance has been hurt by an underweight position in Richemont and Naspers, both of which have performed significantly better than the ALSI over the period and are a large part of the index (i.e. they have been underweight detractors). When investing in a concentrated market like South Africa's, the shares we miss out on can be just as important in determining our relative performance as those we get right.
"RELATIVE PERFORMANCE IS SHAPED JUST AS MUCH BY THE SHARES WE DON’T HOLD, AS BY THE SHARES WE DO ON BEHALF OF OUR CLIENTS"
Attribution methods differ
The methods described above are not the only way a fund manager can perform an attribution analysis. It is important to bear in mind that one method is not necessarily more correct than another and that different types of attributions serve different purposes. Attributions also become more complicated when there are more moving parts. Orbis invests globally in a range of different countries and currencies. This makes their attribution more complicated than the analysis we perform. However, all these methods ultimately have one common goal – to better assist in understanding how the performance of a particular fund has been achieved over a given time frame.
The analysis of fund returns described in this article assists our portfolio managers in identifying and understanding the successes they have enjoyed and the mistakes they have made. This goes hand in hand with the knowledge that, in the face of a constantly changing investment environment, past performance is not a guarantee of future returns. One constant our clients can gain comfort from, is that we will continue striving to best implement the investment philosophy which has delivered superior returns for our clients over the last 39 years.
StatPro Performance and Attribution systems are used to perform the attributions described in this article.