
Recent changes in the composition of the FTSE/JSE All Share Index (ALSI) have sharply reduced the dominance of global giants and boosted the influence of local shares. But this is just the latest chapter in a long story. Indices are always evolving, reflecting shifts in economies, markets, methodologies and investor demand. Matthew Patterson explains why understanding the ALSI’s evolution matters for investors – even as our investment philosophy endures and our approach remains unchanged, regardless of index weights.
From its origins in the gold-fuelled speculation of the late 19th century to today’s digital trading floors, the Johannesburg Stock Exchange (JSE) has long been at the heart of South Africa’s capital markets. More than just a marketplace for shares, it reflects the changing face of the South African economy. Its most well-known index, the FTSE/JSE All Share Index (ALSI), captures the market’s pulse and provides a standard against which many local equity investors measure their success.
Indices are never static, as reflected in the changes to major indices worldwide over the decades – from the US’s S&P 500 to Japan’s TOPIX. For example, the composition of the S&P 500 has shifted from being heavily weighted towards industrials to being heavily weighted towards the technology giants today, as the US economy has evolved. The ALSI is no exception.
Looking back
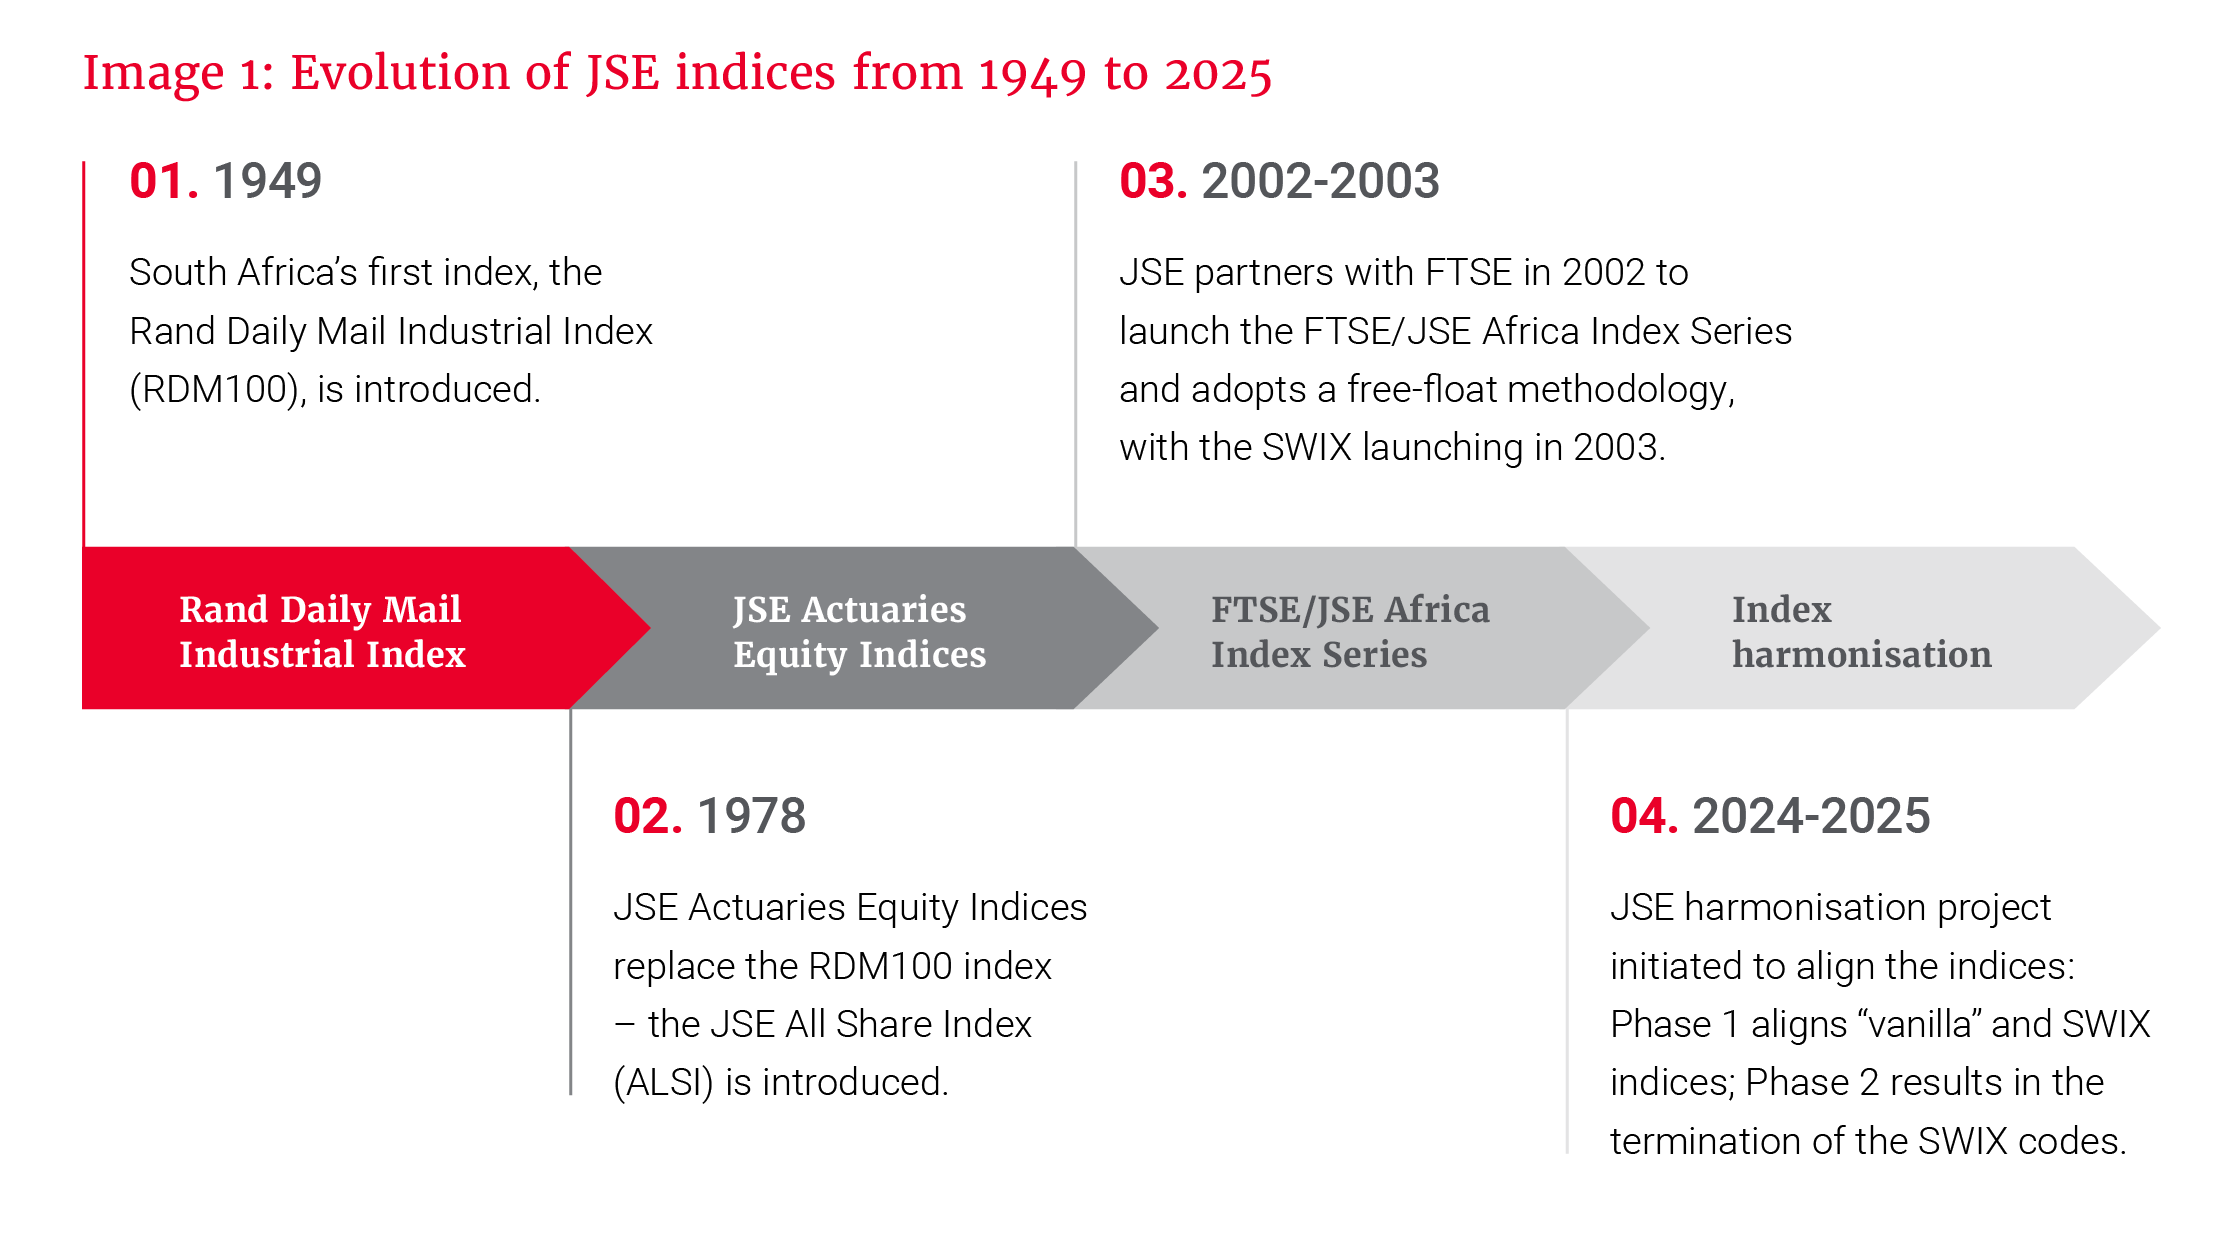
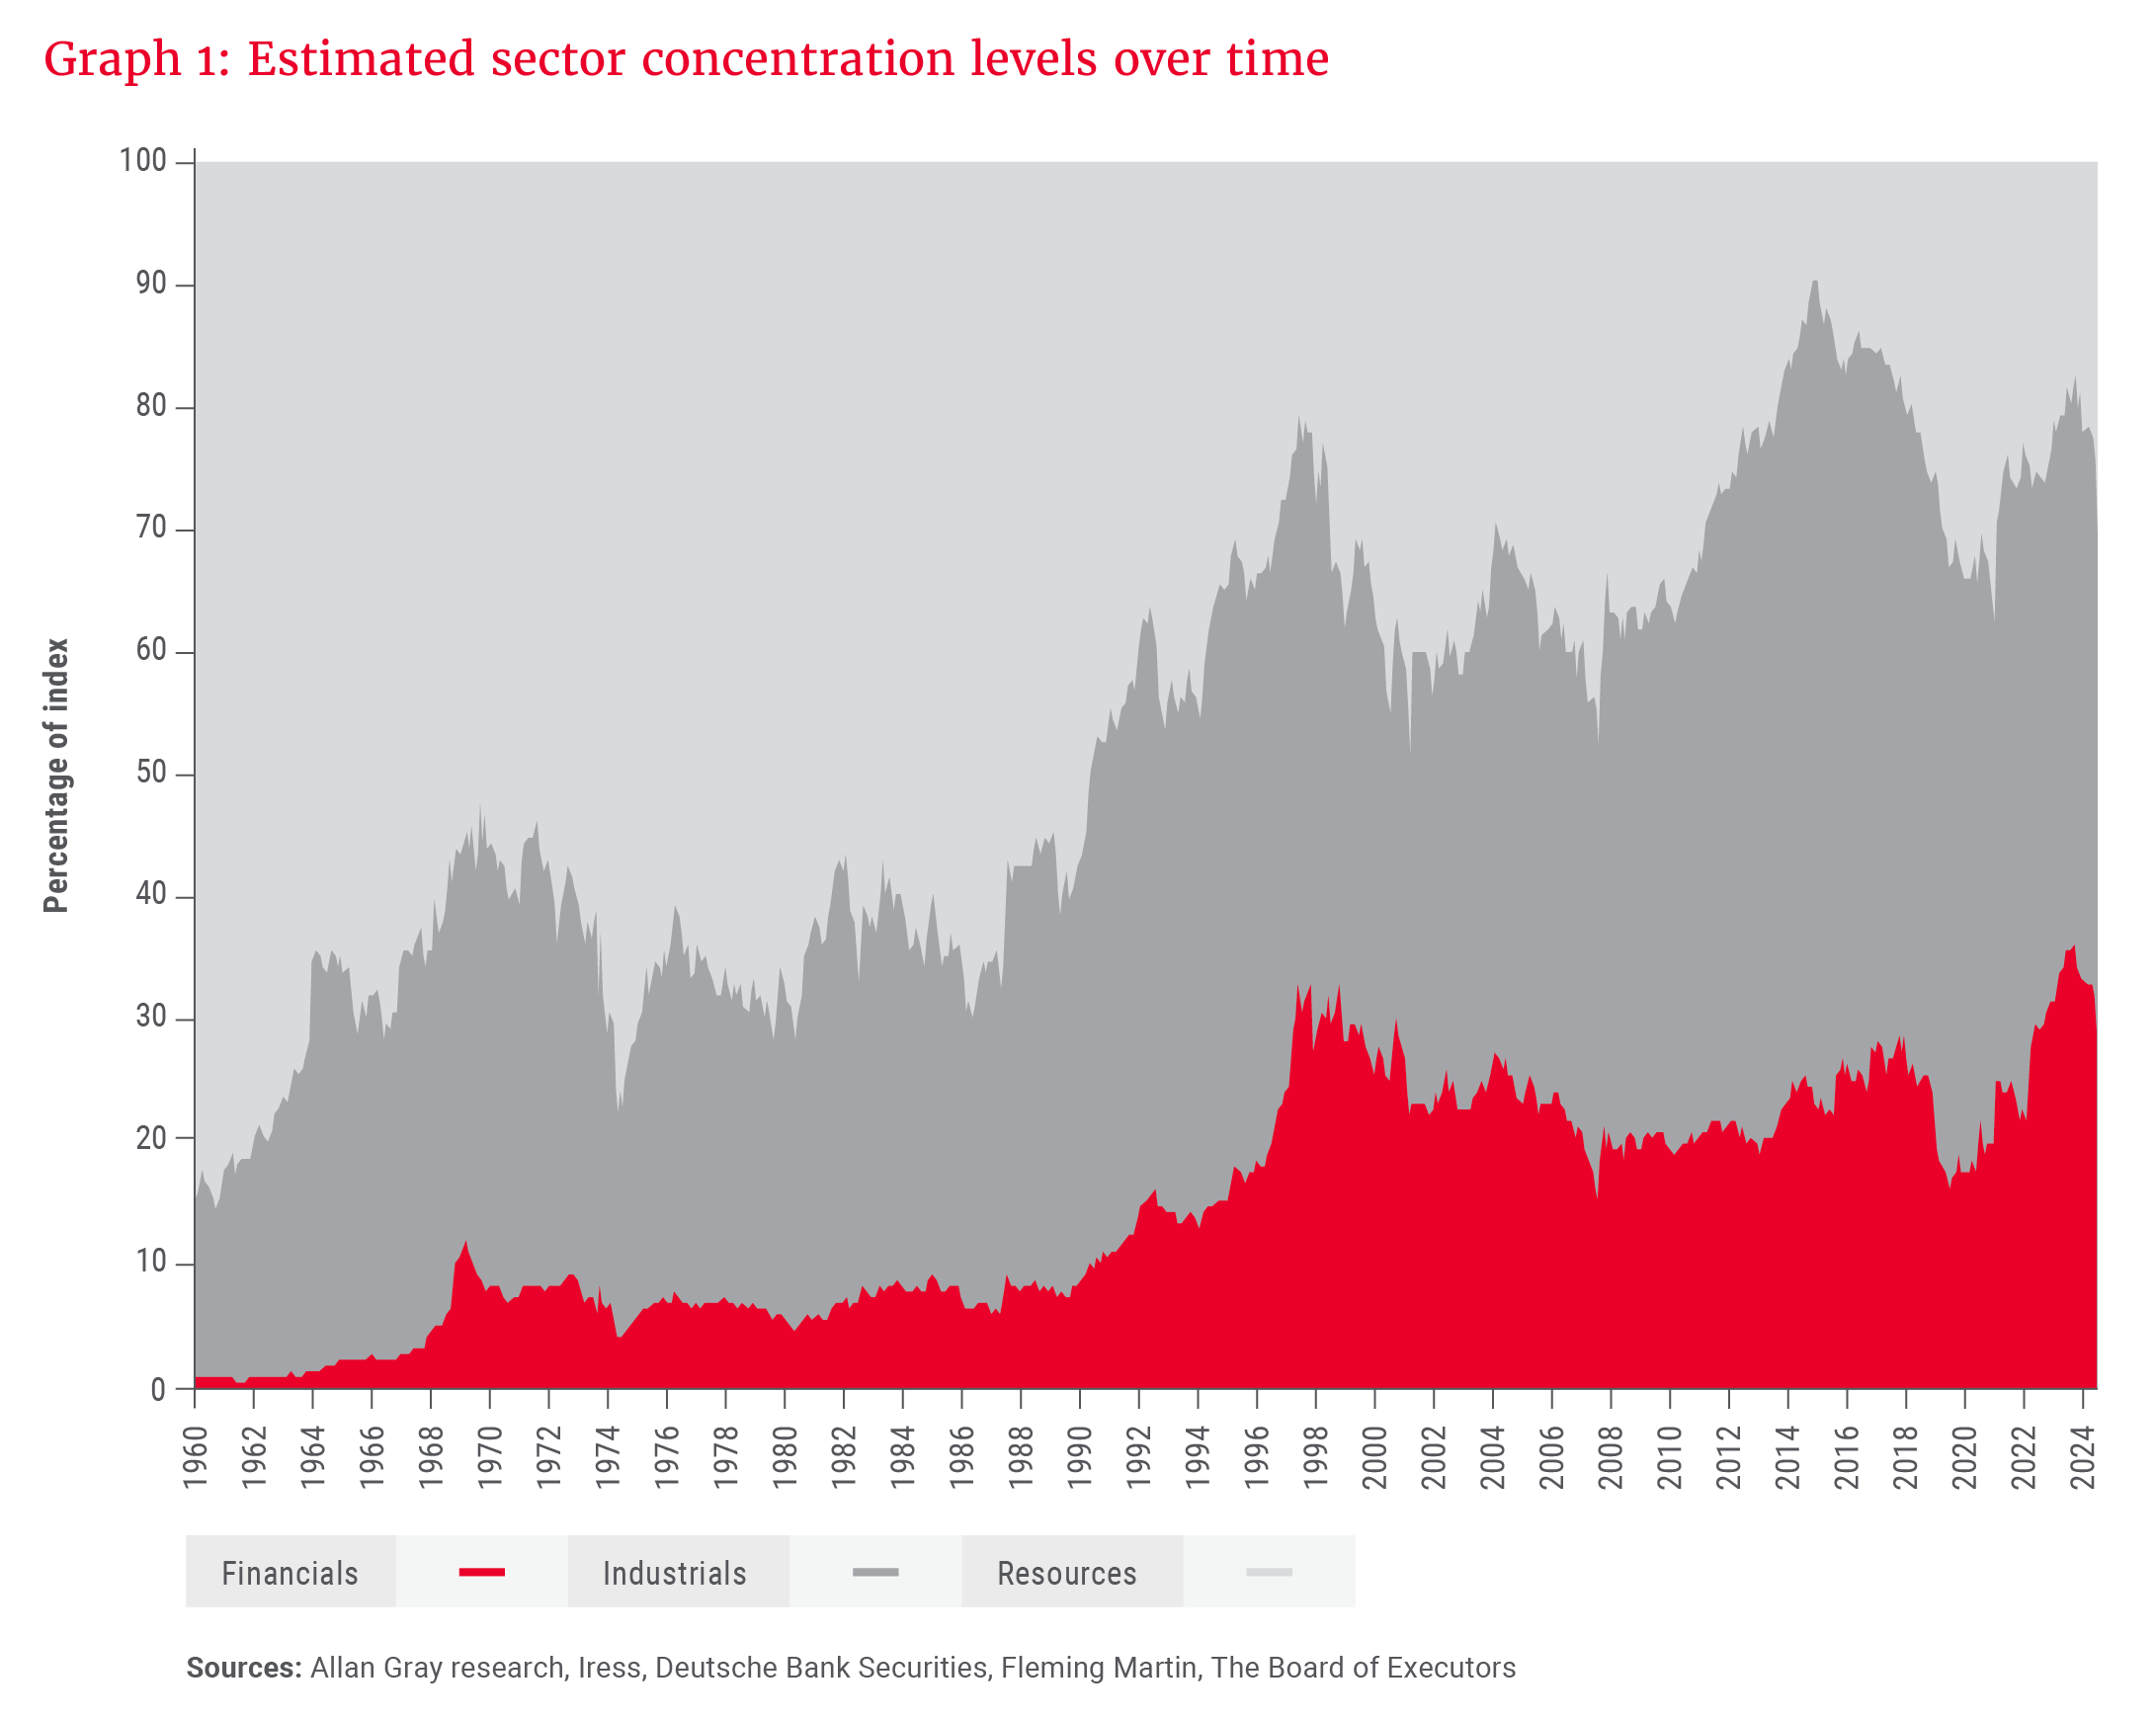
South African indices have evolved over time, as shown in Image 1. Launched around 1949, the Rand Daily Mail (RDM) Industrial Index was the leading benchmark for the South African market until 1978. Although details of its construction are scarce, we know it was weighted by company size (market capitalisation). By 1978, the need for a more comprehensive and representative measure of the market led to the introduction of the JSE Actuaries Equity Indices. This new suite of indices, which included the original ALSI, broadened coverage to include more companies across all sectors – covering about 80% of the listed market – and was linked to the older RDM indices from 1960 to 1978 for continuity. At the time, resource shares made up 68% of the ALSI, as seen in Graph 1, reflecting the sector’s outsized role in the economy.
By the end of the 1980s, resources still dominated, but the seeds of diversification were being sown. In the 1980s and 1990s, the ALSI’s composition shifted as industrial and financial companies gained ground. In 1995, the ALSI’s methodology expanded to include nearly all JSE-listed companies, with only a few exclusions for foreign-dominated holdings – reflecting a more diverse and interconnected market.
The ALSI’s evolution reflects the shifts in the economy, in regulation and in global capital flows.
For years, the indices counted every share, even those locked away overseas or held by founding families who would never sell. It was like tallying every seat in a stadium, even those permanently reserved and never available. Then, in 2002, the JSE partnered with FTSE to launch the FTSE/JSE Africa Index Series. It adopted a free-float methodology that only counts the shares available for public trading. This resulted in an investable index, providing a truer reflection of what investors could actually buy.
Harmonisation: One set of indices
Despite these improvements, inconsistencies remained. In the late 1990s and early 2000s, several South African companies moved their primary listing overseas, mainly to London, to more easily access global capital. To prevent a major outflow of domestic assets, the South African Reserve Bank “grandfathered” these firms, treating them as local for regulatory purposes.
This resulted in two sets of indices: the “vanilla” indices (which include the ALSI) and the Shareholder Weighted Indices (SWIX). “Vanilla” refers to the version of the indices that comprises the full global market capitalisation of grandfathered shares: While technically South African, in practice, these shares were about as local as a Nando’s in London. By contrast, the SWIX only counts the shares that one can actually buy on the JSE. Asset managers have favoured the SWIX and Capped SWIX (which caps weightings to reduce concentration risk) as benchmarks, as they better reflect the investable universe for local investors.
the ALSI will finally be what many assumed it was: a fair, investable reflection of the South African market.
Over time, the number of grandfathered companies shrank. Brewer SABMiller was acquired by AB InBev, miner Billiton merged with BHP, and luxury goods company Richemont’s special shares – known as depositary receipts, which are certificates that let investors trade a foreign company’s stock on the local market – disappeared. By 2024, only miner Anglo American, paper and packaging company Mondi and financial services company Investec remained as key outliers.
To resolve these anomalies and bring greater consistency, the JSE launched the harmonisation project. In March 2024, the first phase of the project aligned the vanilla and the SWIX indices, making their weighting methodologies identical. In practical terms, the individual stock weights in the vanilla indices are now identical to those in the SWIX. By the end of December 2025, the SWIX will be discontinued, and the ALSI will finally be what many assumed it was: a fair, investable reflection of the South African market.
Impact and evolution: Less London, more Johannesburg
Harmonisation sharply reduced the weight of global giants like Anglo American and Mondi, upweighting other constituents – especially financials – and reducing the ALSI’s indirect offshore exposure by treating grandfathered shares the same as all other local shares. Corporate actions (as discussed earlier) also accelerated the shift towards a more locally reflective ALSI.
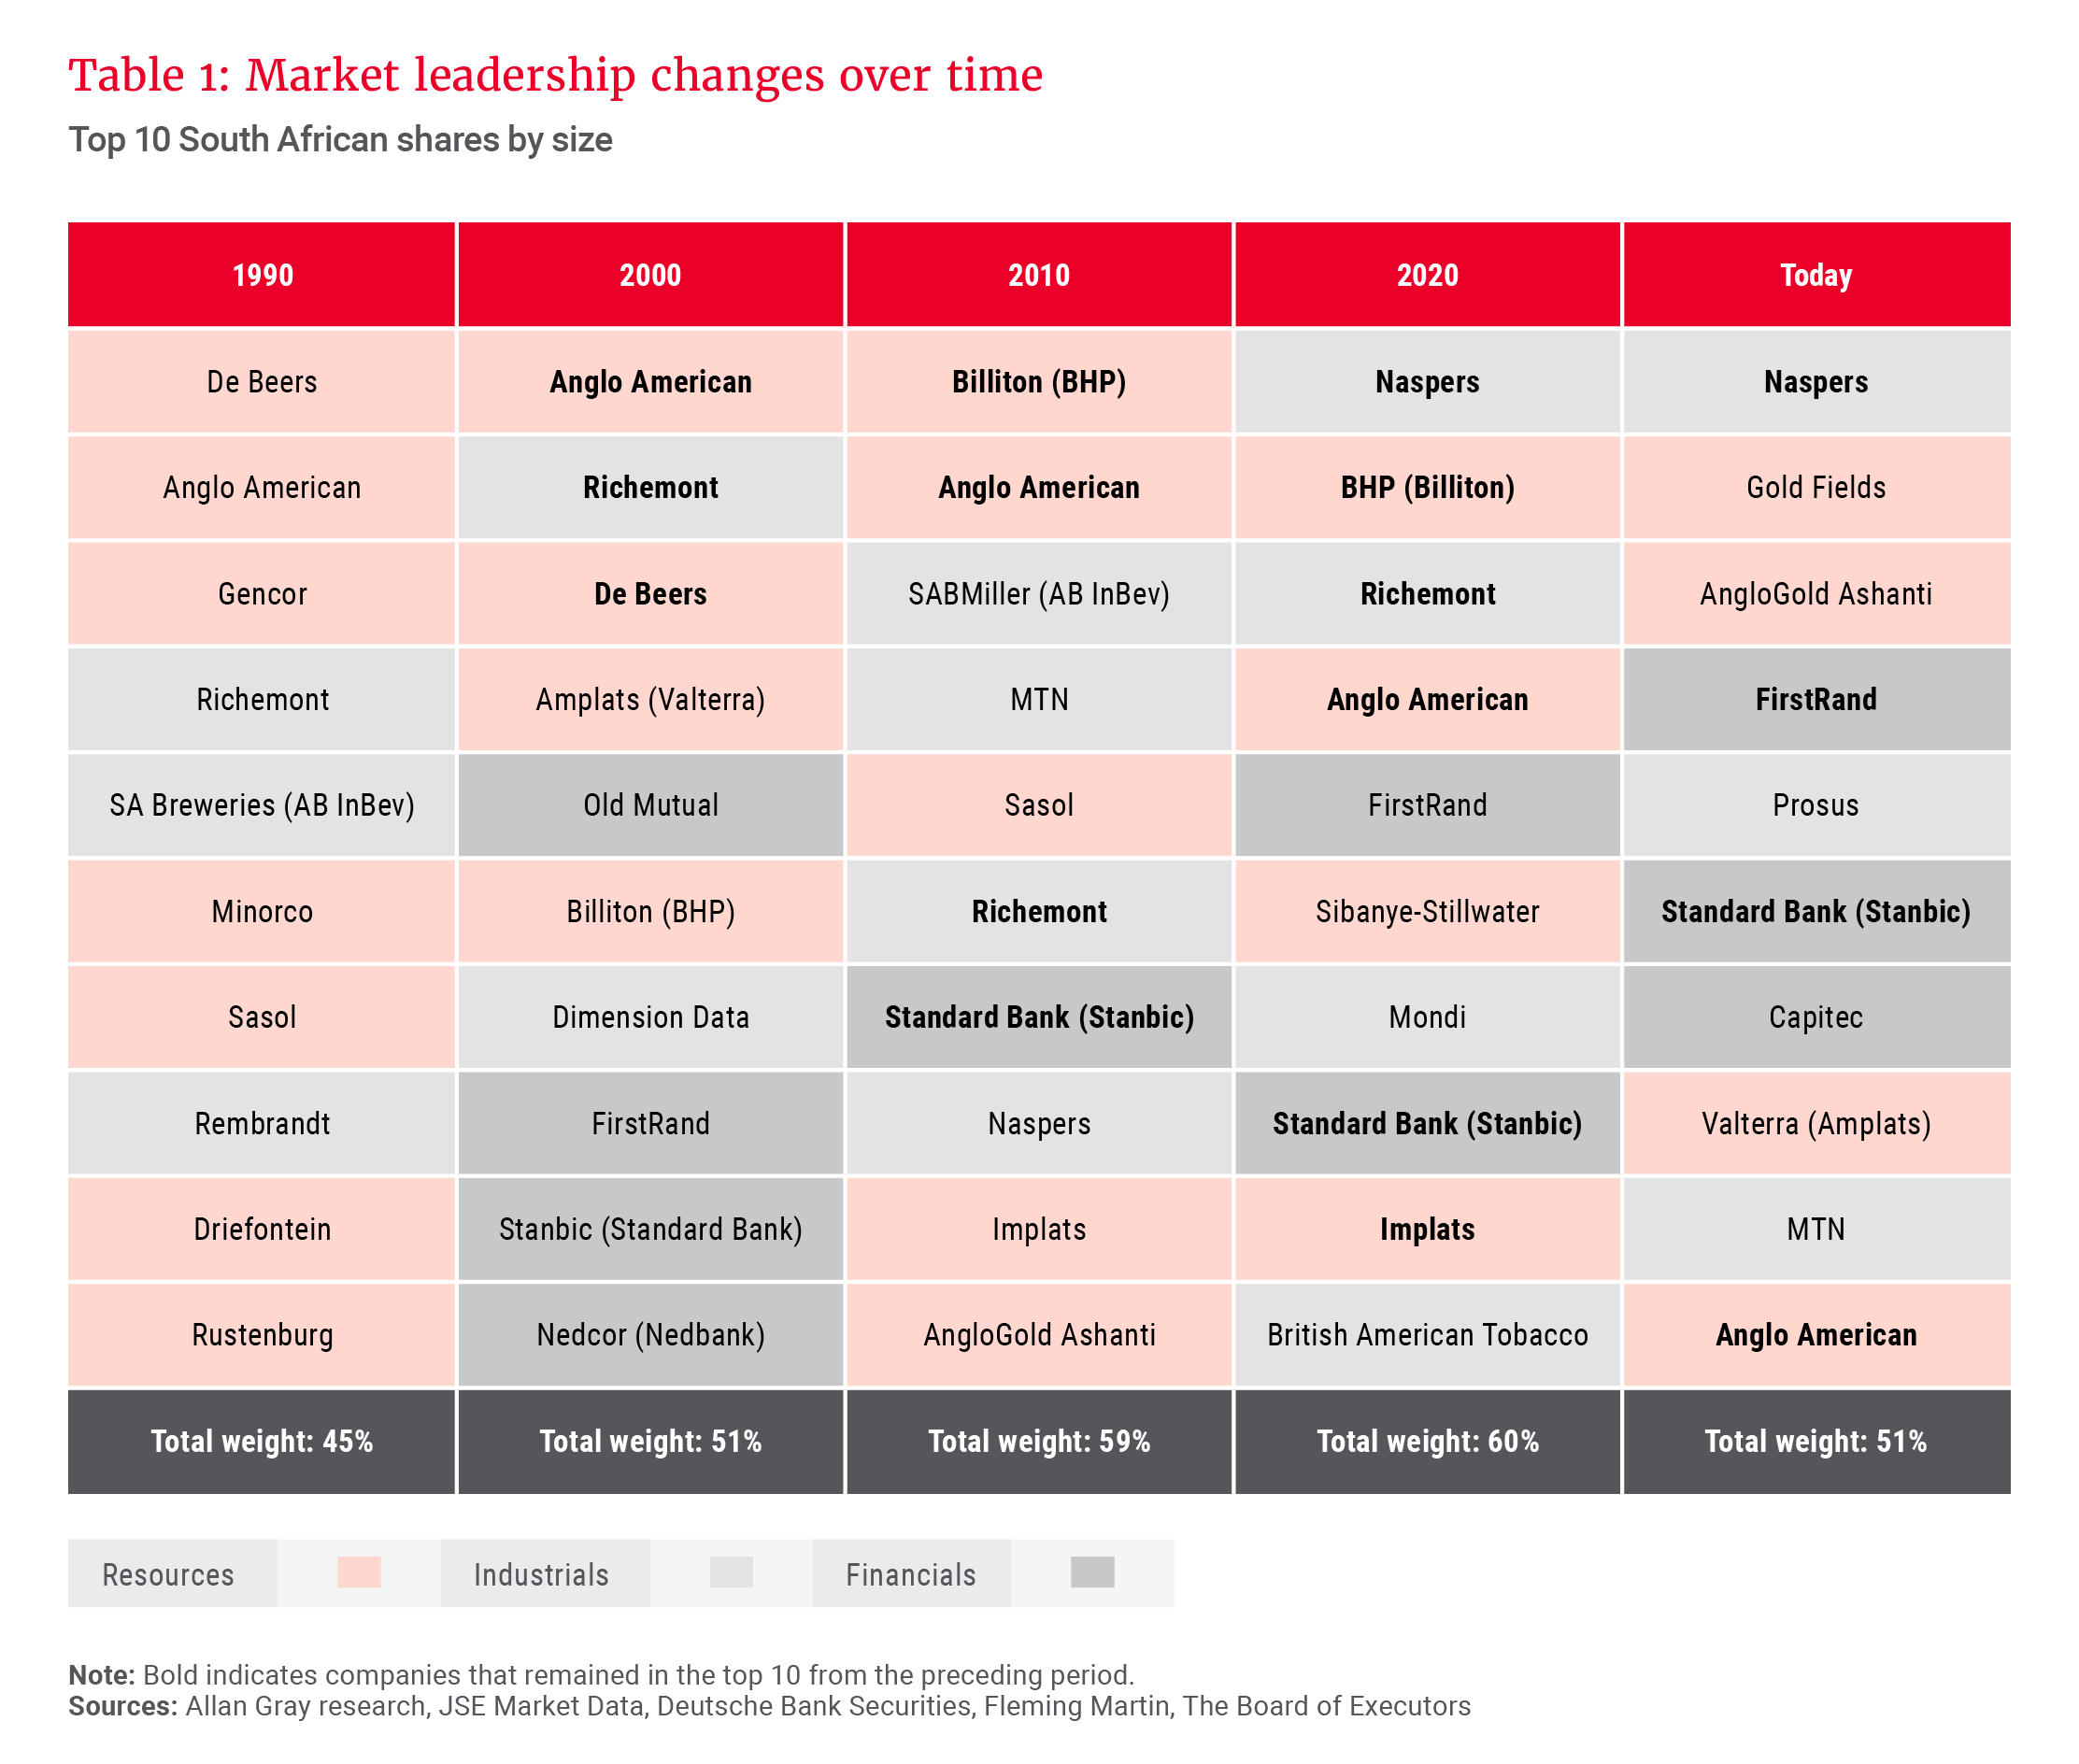
As South Africa’s economy has diversified, so have its markets. The top 10 shares have always dominated the ALSI, but the market leaders and sector compositions have shifted over time, as illustrated in Table 1. In 1990, the market leaders were resource companies with a few industrial heavyweights. Today, the 10 largest companies by market capitalisation still account for about half of the market, but with greater sector diversification and much fewer cross-holdings. The composition of the 10 largest shares changes regularly, but within a relatively small group. Of the top 10 in 1990, only Anglo American has remained a consistent member of this elite group. Since the modern ALSI was launched in 2002, only 24 unique shares have featured in the top 10.
Sector shifts: The ALSI’s changing face
The ALSI’s evolution is not just about individual companies; it also reflects dramatic sector shifts. Resources fell from 85% of the index in 1960 to under 10% by 2015, replaced by industrials, banks and consumer stocks. More recently, this trend has partially reversed, with resources rebounding to 30% of the index today, as shown earlier in Graph 1, driven largely by the gold bull market.
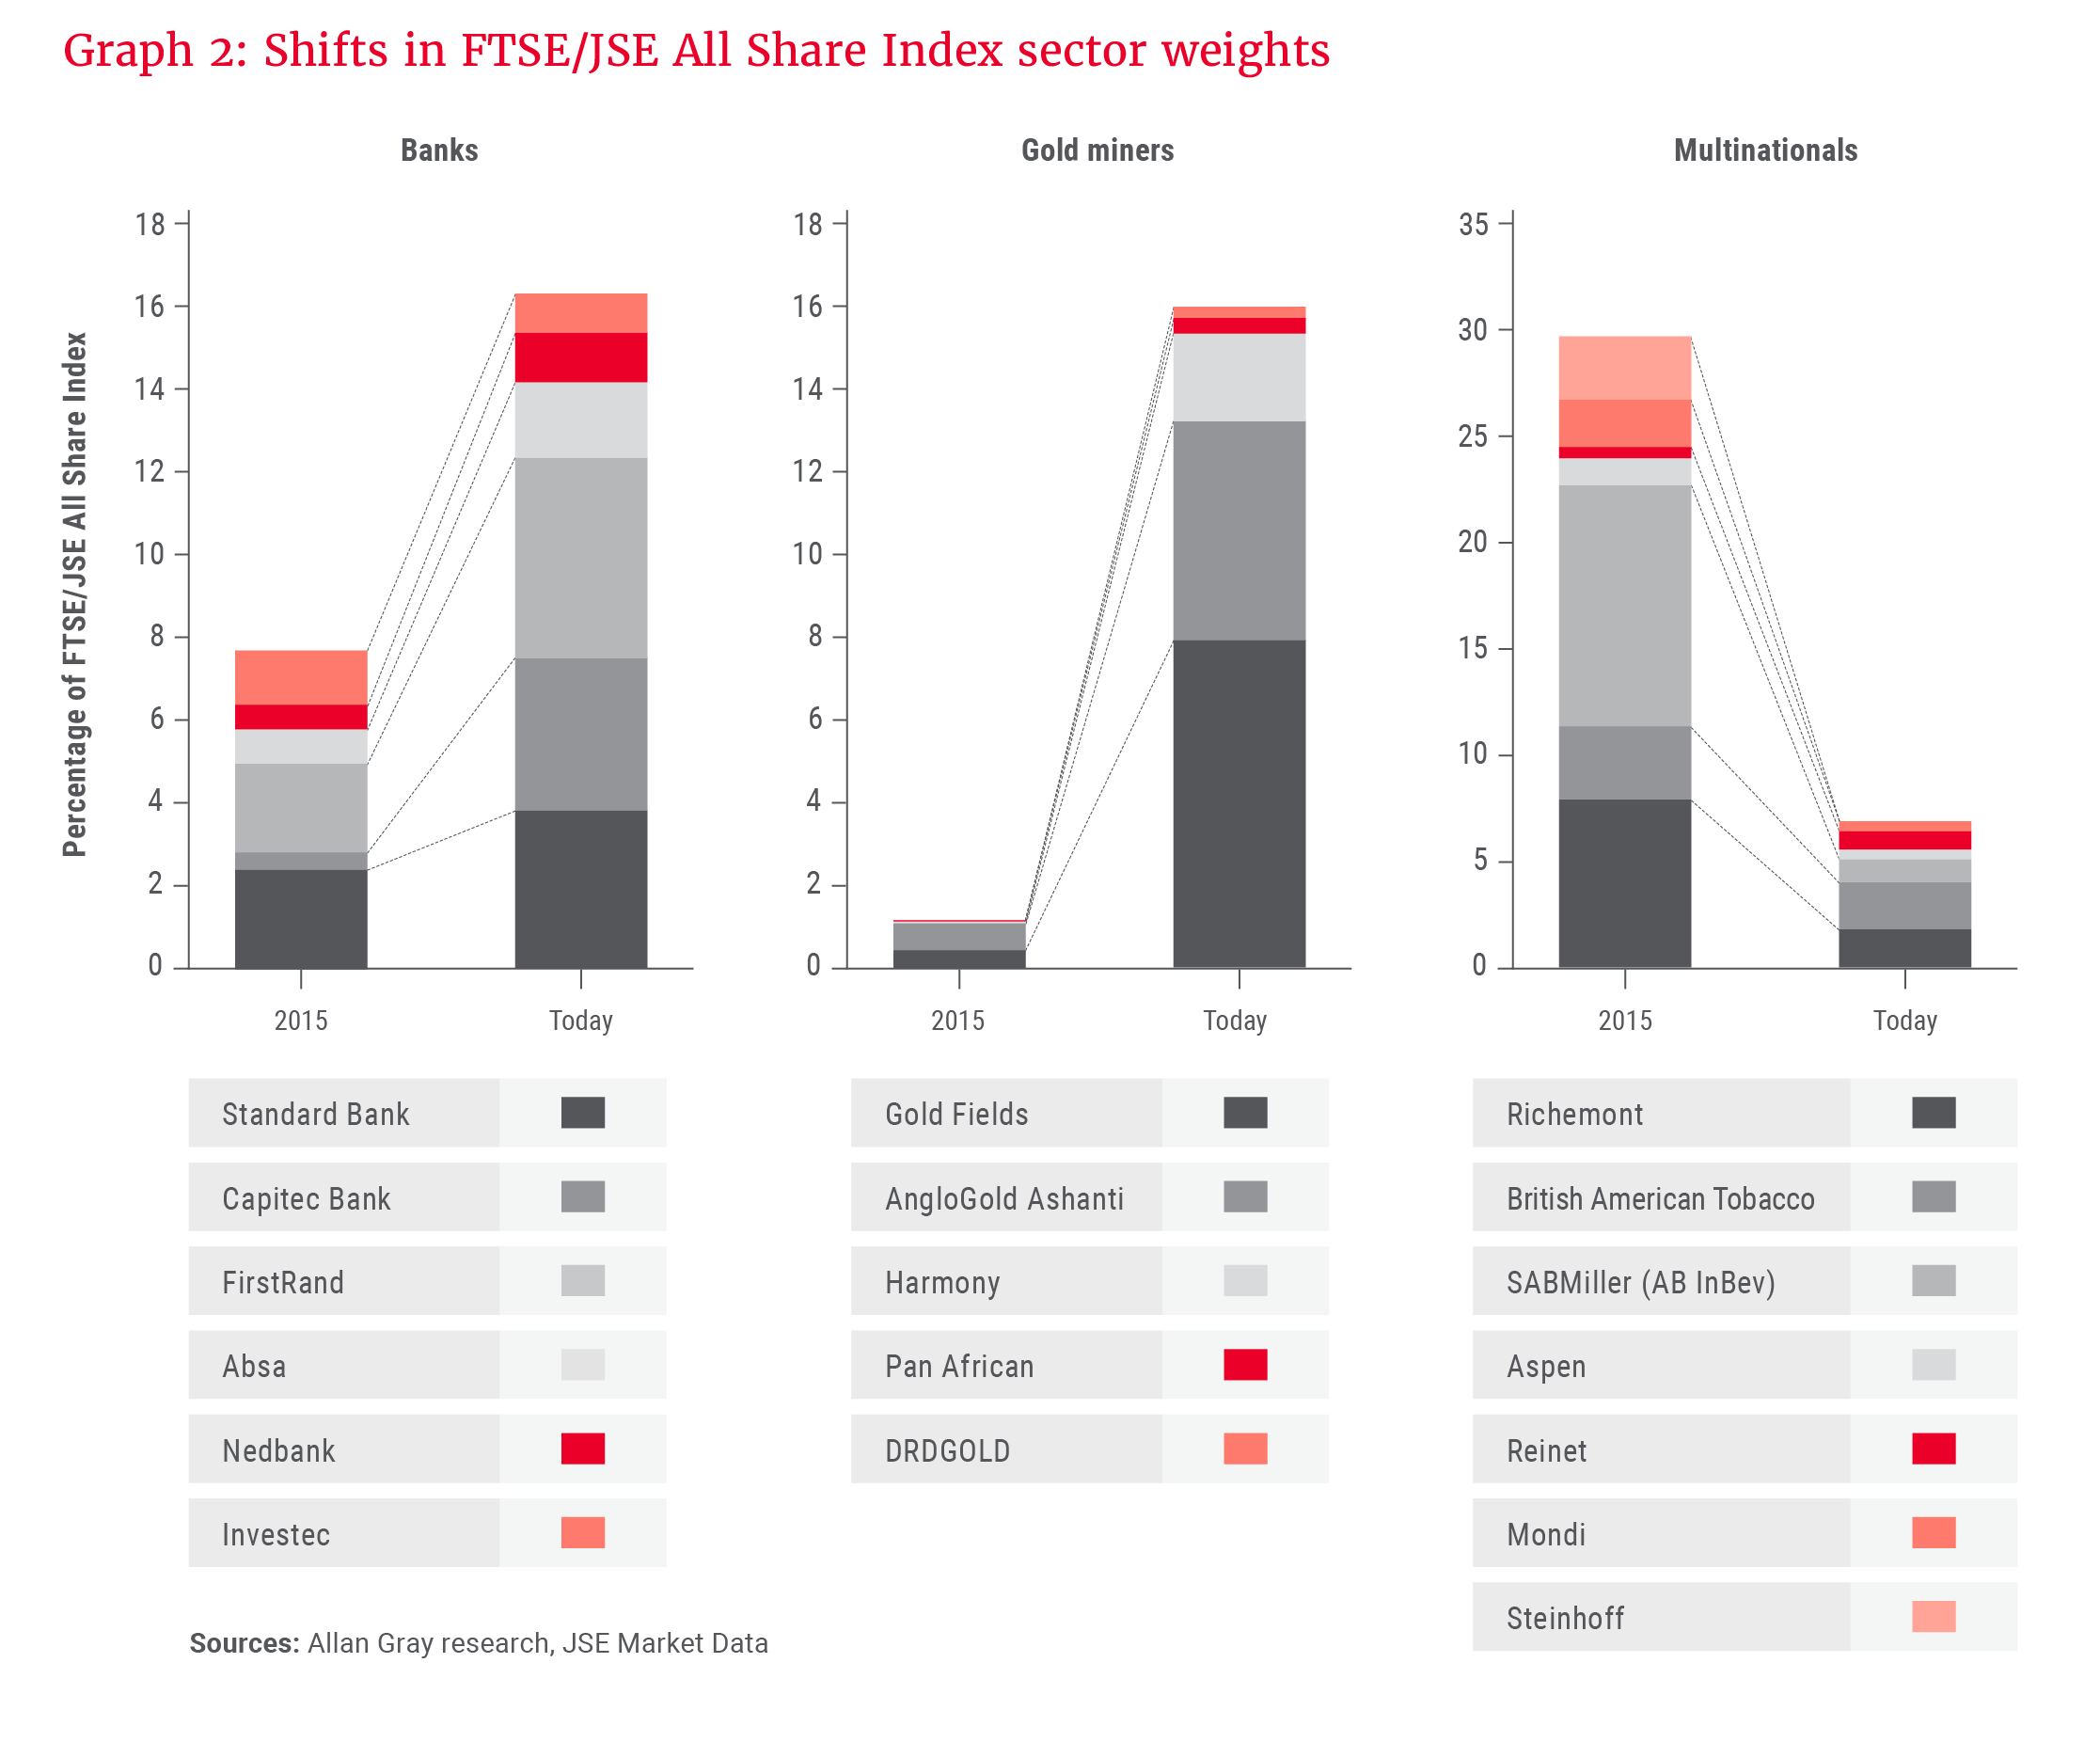
A decade ago, the ALSI was dominated by global multinationals and diversified miners. Today, banks, gold miners and technology giant Naspers/Prosus lead the index, as highlighted in Graph 2. Capitec has grown from a rounding error to nearly 4% of the index. Gold miners, buoyed by global uncertainty and central banks buying gold, have increased their index weight by 1 300%. Meanwhile, the major multinationals have shrunk from 30% to just 7% of the index due to delistings, fraud (Steinhoff) and index methodology changes.
Why does this matter for investors?
The ALSI’s evolution reflects the shifts in the economy, in regulation and in global capital flows. Harmonisation is simply the latest step.
When you hear that the ALSI is up or down, ask: What has actually moved underneath? The details matter. Investors who assume the ALSI is still dominated by large rand-hedged firms may be surprised to find that it is now driven by local banks, gold miners and Naspers/Prosus.
… the ALSI remains a useful reference for understanding the market’s shifting shape, and for comparing our performance to the broader market.
Crucially, as mentioned earlier, a changing index does not change how Allan Gray invests. As bottom-up investors, we build our portfolios company by company, focused on long-term value creation, while being mindful of risk. For us, risk means the permanent loss of client capital.
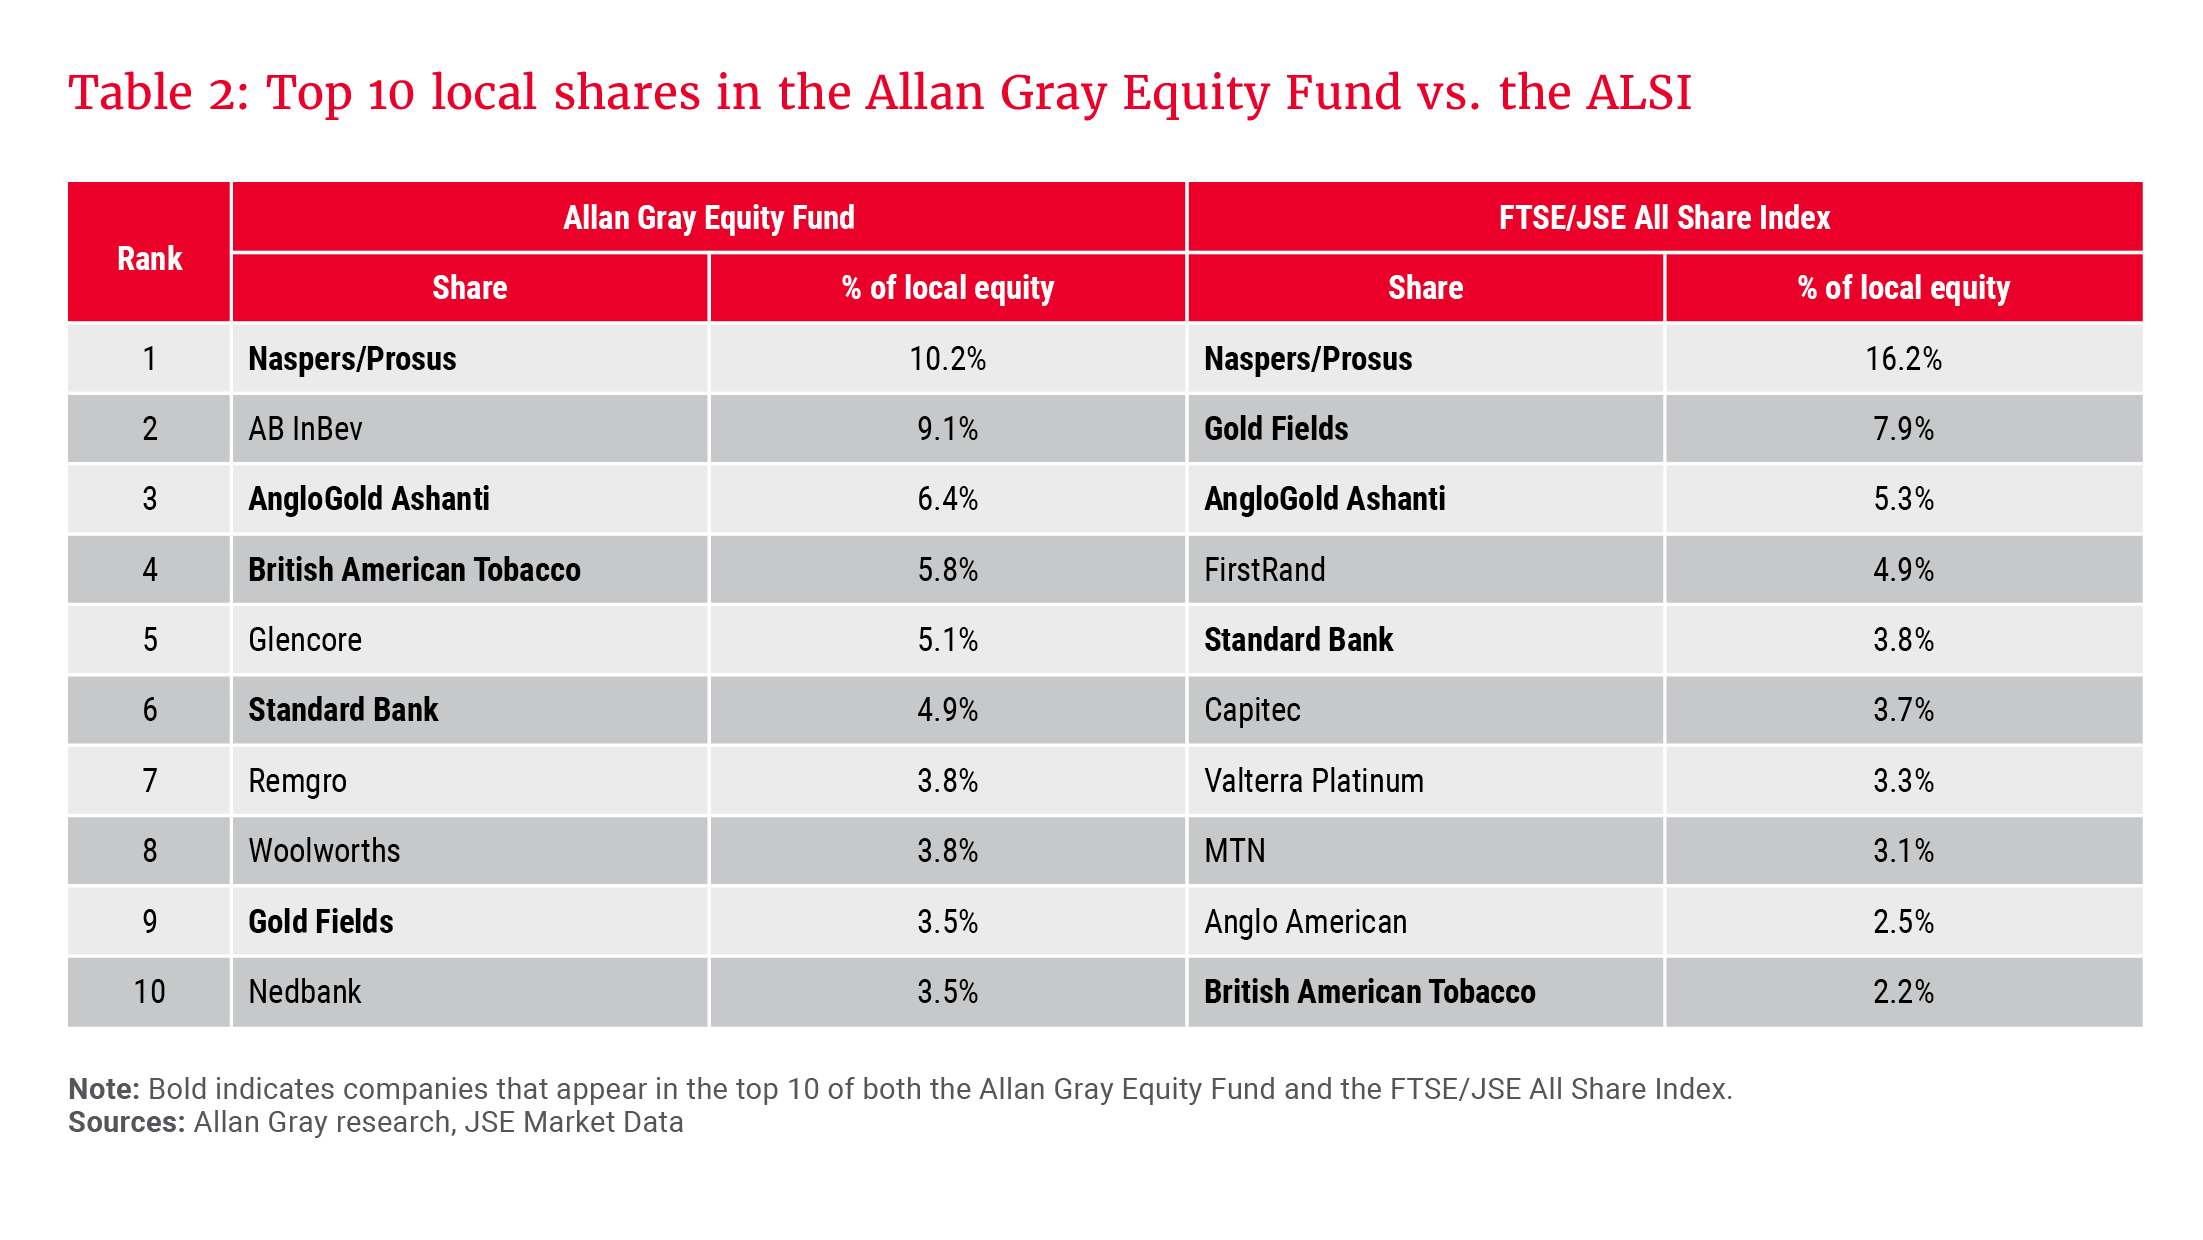
We manage risk by limiting how much we hold in each share, ensuring exposure reflects our assessment of its underlying risk, regardless of its index weight. As a result, we are comfortable looking different from the ALSI, as shown by our current positioning in Table 2. Even so, the ALSI remains a useful reference for understanding the market’s shifting shape, and for comparing our performance to the broader market. The ALSI is best used as a mirror, not a map.
Explore more insights from our Q3 2025 Quarterly Commentary:
- 2025 Q3 Comments from the Chief Operating Officer by Mahesh Cooper
- How Booking.com changed the way we travel by Thalia Petousis
- Peeling back the layers in Remgro and Reinet by Jonty Fish and Malwande Nkonyane
- Orbis Global Equity: Biotech breakthroughs in a crowded market by Graeme Forster and Mo Zhao
- How to unlock value through offshore investing by Horacia Naidoo-McCarthy and Radhesen Naidoo
- How to safeguard your investments by Twanji Kalula
To view our latest Quarterly Commentary or browse previous editions, click here.