We pick shares for client portfolios following a rigorous, bottom-up, fundamental research process. This involves, among many other considerations, the careful scrutiny of audited company results, presentations and annual reports. We use these sources of information as the building blocks in our process to determine the fair value of a share for potential investment. Leonard Krüger shares some of the intricacies of the process, cautioning that accepting the building blocks at face value may at times be deceptive. He offers a few pointers on some of the nuances to consider.
Companies report a host of numbers to the market every six months, often in excess of a hundred pages. Profit or Earnings Per Share (EPS) commonly receives the most market attention. EPS is after all a key variable in favoured valuation metrics like the Price-to-Earnings (PE) ratio, earnings yield and dividend pay-out ratio.
Listed companies are required to follow prescriptive accounting rules and to report on their financial situation according to the International Financial Reporting Standards (IFRS), which South Africa adopted in 2005. In the US, companies use Generally Accepted Accounting Principles (GAAP).
Management teams however often argue that IFRS and GAAP do not fairly represent the economic reality of their businesses and, for that reason, present an alternative interpretation of EPS. This has given rise to numerous mutations of EPS, referred to as either ‘normalised’, ‘adjusted’, ‘headline’, ‘continuing’, ‘diluted’, ‘attributable’ or my personal favourite, ‘comparable normalised headline’ EPS. It is not unusual for a company to report six or more different EPS numbers when presenting results. Which one is right in this confusion?
Companies on average tend to present a far more favourable EPS number than that dictated by the accounting rules.
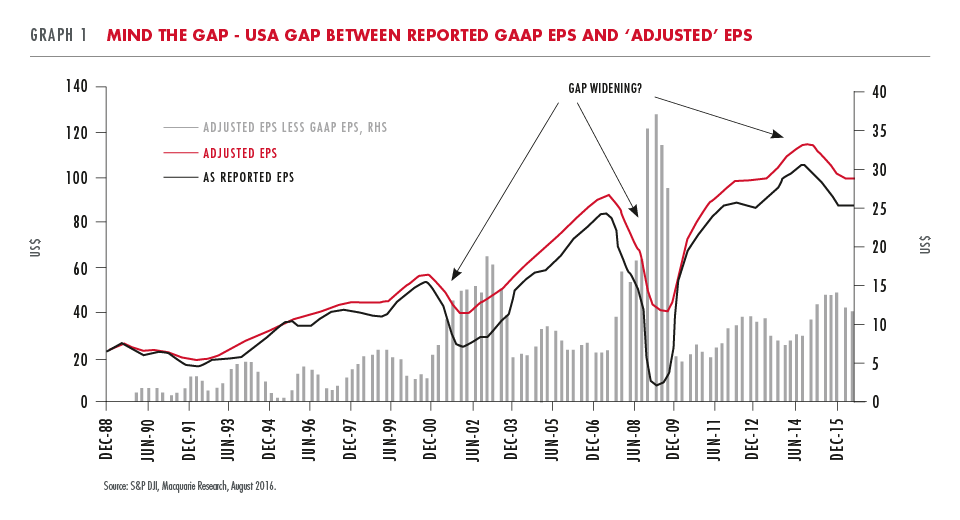
While some adjustments are valid, companies on average tend to present a far more favourable EPS number than that dictated by the accounting rules. This gap between reported EPS and the adjusted EPS can be seen in the US example in Graph 1.

This gap has actually increased since 2009 and averaged 15% in more recent company reports. Consider the average company growing at 5% per year: it will take three years for the ‘as reported’ EPS to catch up with the adjusted EPS. It is also true that in a number of cases management compensation is based on adjusted EPS, providing a powerful incentive to report adjusted EPS as high as possible. Investors are often unaware or ignorant of these upward biases. We prefer to use our own judgement when assessing adjustments to IFRS accounts. We also consider the usefulness of a given metric for each company we research.
Different metrics for different industries
Let’s consider some examples:
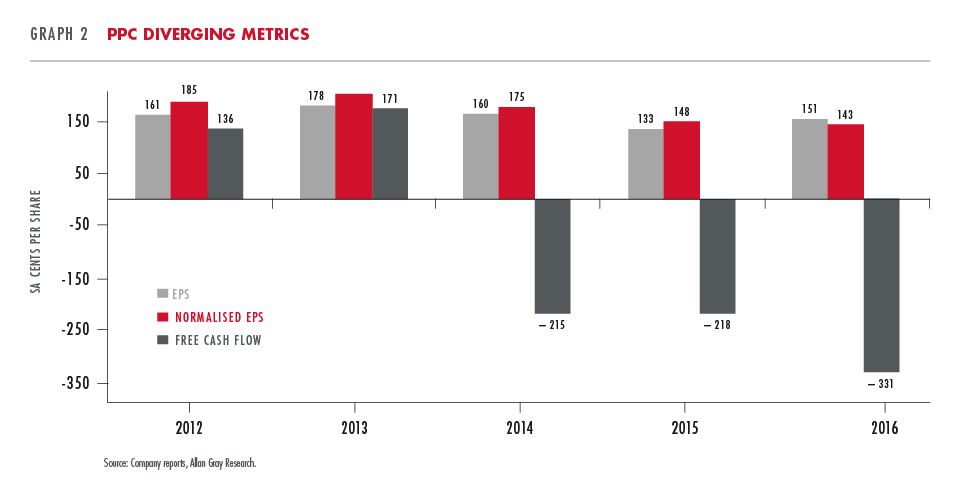
PPC, the South African cement maker, completed a deeply discounted recapitalisation of its business in September this year. Graph 2 illustrates the reported EPS and normalised EPS as presented by PPC since 2012. An investor who only focused on PPC’s normalised EPS would have noticed a business with declining profits but may nevertheless have been comforted by what still seemed like a solidly profitable enterprise reporting in excess of 140 cents per share of profit as recently as March 2016. This hypothetical investor would have failed to recognise the substantial negative free cash flow per share PPC had been incurring since 2014 and the deteriorating balance sheet and liquidity position of the company.

Normalised EPS was thus an inappropriate metric and a valuation pitfall in the case of PPC, proving the old adage that, ‘profit is what you report, cash is what you make’.
The market focuses on different metrics for different industries. Foreign property companies for instance prefer to look at a Price to Net Asset Value (P/NAV) metric rather than traditional EPS. Using this metric, a property company is considered cheap if the price is lower than its NAV. However, like normalised EPS, there are nuances to the numbers in this seemingly simple P/NAV metric: the NAV is a balance sheet number based on an external valuator’s opinion using backward-looking market evidence. The NAV also does not consider income statement realities like the overhead expenses incurred by the company.
The Johannesburg-listed UK mall owner, Intu Properties, is a good example. At first glance the company appears attractive on a P/NAV metric, in recent times trading at a discount of up to 30%. However, overhead expenses amounted to GBP38m in 2015 – a cost an investor can almost certainly expect to incur every year. By just capitalising such a cost liability at a similar yield to value the property assets of Intu Properties, a 15% discount is already justified. What appears to be a discount to NAV in many such property companies can simply turn out to be a reflection of the structural economics at play.
Not all negative
Nuances and valuation pitfalls or opportunities need not always hold negative implications from an investor’s point of view. Life insurance companies arguably have more nuances in reported IFRS numbers than any other industry. To aid investor understanding they also publish an Embedded Value (EV) statement every six months. EV can roughly be described as the estimated fair value, as calculated by the actuaries of the life company, of all the current business (policies) of the insurer. The typical insurer writes new policies on a daily basis, policies it expects to make money from in the future. EV places no value on the ability of the insurer to write these new policies. If an insurer has a track record of a conservatively stated EV, there is a good reason for it to trade at a premium to published EV numbers.
So what should you do?
- For the weary reader confused by the long list of acronyms, terminologies and seemingly endless nuances and pitfalls, the message is this:
- View reported and adjusted published numbers with a fair dose of scepticism.
- If the difference between reported and adjusted numbers is large or increasing, history suggests that additional caution is warranted.
- Look beyond the metrics the market focuses on.
- Don’t rely on a sole metric: an investor focused on only one metric might fail to identify risks and/or opportunities.
- Understand why company managers or investors are focusing on the metric being presented and the implications of this.
OR (please forgive my plug)
- Select an investment manager dedicated to active, fundamental research with resources to understand and interpret the facts and figures.
Entrusted with your savings, you have tasked us to navigate these nuances and pitfalls on your behalf, a task we relish and extensively debate internally on a daily basis. We scrutinise the numbers, question the adjustments and hold the management of invested companies to account. Doing so consistently is part and parcel of our investment process and philosophy to ultimately deliver superior investment returns over the long term.