Standard Bank is a Top Five holding in the Allan Gray Equity and Balanced Funds. Mark Dunley-Owen discusses why we believe it is an attractive investment for our clients.
Regular readers of our Quarterly Commentary will be familiar with our investment philosophy. We use our analysis of the fundamentals of a business to determine its intrinsic value or worth. We then compare this with the price the market places on the business (the share price). If we can buy the shares of the business for a lower price than we believe they are worth, we will do so.
STANDARD BANK HAS REFOCUSED ON WHAT IT DOES BEST, NAMELY AFRICA
How do we calculate the underlying value of a company?
We use various metrics for calculating a company's underlying value. One of these, return on assets or ROA, is a useful metric for capital intensive industries such as banking. The text box shows how it can be used in a valuation model for Standard Bank.
At its simplest, a company makes money by earning profit from its assets. This is known as return on assets, or ROA. It
can be used to value Standard Bank as follows:
Value = Assets x long-term ROA x long-term price-to-earnings multiple
Where
Assets = Standard Bank’s disclosed banking assets at a point in time
Long-term ROA = Standard Bank’s average return on banking assets since 1975 = 1.18%
Long-term price-to-earnings multiple = Standard Bank’s average price-to-earnings multiple since 1975 = 11.2x
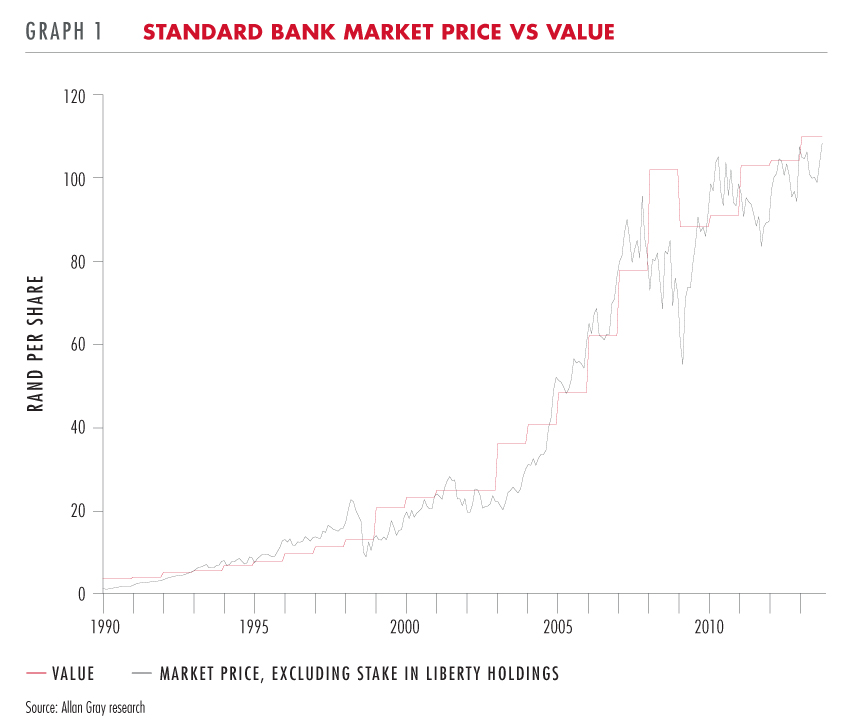
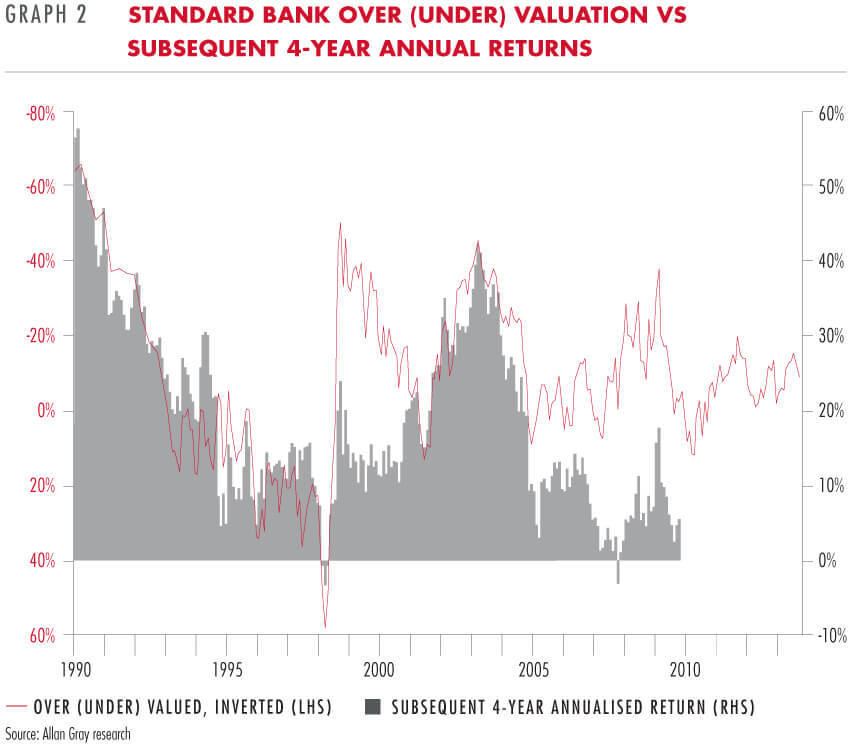
Using this model, Graph 1 shows Standard Bank's value versus its market price since 1990. A value higher than price suggests Standard Bank was undervalued, and vice versa. Graph 2 shows the same data as a percentage of how over or undervalued Standard Bank was at a point in time. It compares this to the subsequent annual return one would have earned by buying Standard Bank at that point in time and holding it for four years.


While far from perfect, this model is appealingly simple. It suggests that buying Standard Bank when it is undervalued, in other words, when the red line in Graph 2 is high, results in higher subsequent returns. This is in line with our investment philosophy. Standard Bank was at its cheapest in 1990. Buying it then resulted in the highest four-year returns over this period. Similarly, buying it at other extreme valuation discounts also resulted in above-average returns. Conversely, buying Standard Bank when it was most expensive in March 1998 was one of only two occasions when an investor would have earned a negative return over the subsequent four years.
Has banking changed?
It is notable that in Graph 2 the relationship between valuation and returns seems to have changed since 2005. The shape of the model remains predictive, meaning returns are higher when Standard Bank is more undervalued, but the absolute level of returns is lower. This leads to the question: has banking, and Standard Bank in particular, changed since the mid-2000s?
There is a perception that banking has changed over the last few years due to increased regulation, introduced in an attempt to avoid a repeat of the 2008 global financial crisis. The new regulations have a common goal of requiring banks to take less risk, which in turn means they earn less return.
There is a similar perception that the South African banking industry has changed. Increased oversight by regulators, aggressive advertising campaigns such as FNB's Steve, and growing popularity of Capitec, all point to lower future profitability. These perceptions may be true, but they are not unique to today. Regulatory and competitive change has long been part of South African banking. There is no reason to believe today's regulators are better at lowering bank profitability than their predecessors were, or that in the past banks were willing to sacrifice their own profitability for the sake of competitors.
Or has Standard Bank itself changed?
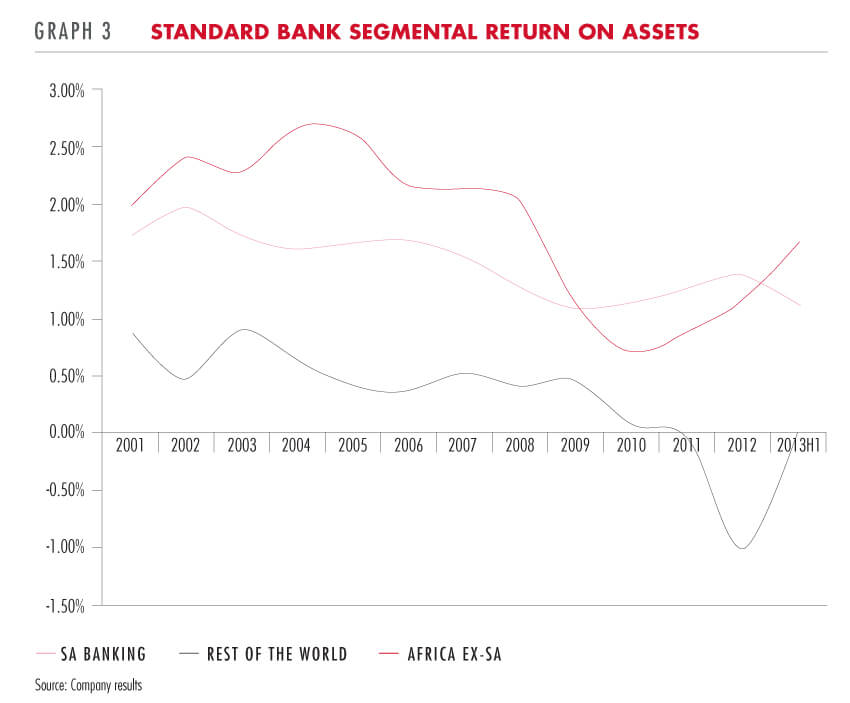
If the above reasons do not seem to be valid explanations for Standard Bank's lower recent returns, one should question whether Standard Bank itself has changed. To answer this, Graph 3 looks at Standard Bank's ROA since 2001, broken down by geography.

The pink line is Standard Bank South Africa. Its current ROA is below average due to some mistakes and a difficult lending environment. We do not believe anything has fundamentally changed at Standard Bank South Africa and expect its ROA to normalise over time.
The red and grey lines are Standard Bank's Africa and Rest of the World businesses. ROA of both dropped materially between 2005 and 2011. While it is unfair to single out one reason why this happened, comments from past Standard Bank annual reports are insightful.
The 2002 annual report was titled 'Blueprint for growth'. In 2005, the bank was 'well positioned to grow acquisitively outside South Africa'. The 2006 Management Report claimed 'our deep roots in a successful developing economy give us the insight to compete in the global emerging markets arena'. By 2010 Standard Bank had bought or built businesses in 13 countries outside Africa, among them Russia, Brazil, Argentina, Turkey and Hong Kong.
As with many aggressive growth strategies, we believe Standard Bank underestimated the challenges of operating in multiple regions. Returns on some of these investments have been disappointing, illustrated by the falling ROA in Graph 3.
In response, Standard Bank has refocused on what it does best, namely Africa. It has divested from or aggressively downscaled its non-African businesses, while continuing to invest across Africa. It now has more than 550 branches in 17 African countries that allow it to offer cross-continent banking. Their local presence plus pan-African capabilities is relatively unique, making Standard Bank a natural partner for companies looking to expand across Africa.
The strategy seems to be working. Standard Bank's businesses outside of Africa are no longer making losses. Africa ex-SA earnings have quadrupled since 2010 and now account for 20% of group banking earnings. In the most recent six months, Standard Bank earned more than R1 billion revenue from South African companies outside South Africa. If this continues, both ROA (in Graph 3) and investment returns (in Graph 2) should recover to historical averages.
A worthwhile investment opportunity?
Standard Bank's earnings are currently below their historical average but we do not believe anything has changed permanently. If we are right and Standard Bank returns to its previous profitability, history suggests it will generate above-average returns for our clients.