Sasol's share price has fared poorly over the past year compared to the 28% appreciation of the FTSE/JSE All Share Index (ALSI). Going forward, Sasol will be a good investment if the rand oil price remains close to, or exceeds R600 per barrel. Andrew Lapping explains why, at its current price, Sasol is Allan Gray's preferred resource share.
The Sasol share price disappointed over the past year, returning 6% compared to the 28% appreciation of the ALSI. Numerous factors influence a share price, but we believe that the primary reason for the underperformance was that the market priced too much positive sentiment into the share in late 2008 and early 2009. Attitudes towards Sasol are now a little different and investor sentiment is possibly too negative.
The oil price in rands is the most important driver of Sasol's earnings. Herein lay the primary disappointment, with the price falling by more than half from June 2008. While revenues declined, Sasol's costs continued to escalate at rates in excess of inflation, reducing margins. Going forward, Sasol should be a good investment if the rand oil price remains close to, or exceeds, R600 per barrel. At this oil price, Sasol is trading at about 10 times earnings.
In a normal environment where we believe the average company listed on the JSE should trade at about 11.5 times earnings, a Price to Earnings (PE) ratio of 10 for a company like Sasol is an attractive proposition. Furthermore, in the current environment where we are finding very few shares trading below 11.5 times earnings based on our normal earnings calculation, a PE of 10 for Sasol is particularly attractive.
The normal oil price
As noted before, the most important variable in calculating Sasol's normal earnings is the rand oil price. We use a normal rand oil price of R600 per barrel. Below I will discuss some of the reasons why we use R600; I will also explain why potential Chinese demand leads us to a generally positive view on the oil price, especially in relation to other industrial commodities.

Increasing production costs
A good starting point when deciding on a normal price is the 10-year average. The oil price has averaged R500 per barrel in real terms over the past ten years, 17% below our normal price of R600. One of the reasons why we use a higher normal price is that, across the world, cost escalation in extractive industries has exceeded Consumer Price Inflation (CPI) by about 6% per year over the past decade. If the rand oil price is deflated by an index representing the actual cost inflation experienced in the resource industry, the 10-year average is above R600.
Increases in costs exceeded CPI over the past decade as the 20-year commodity bear market prior to 2003 forced companies to cut costs aggressively. This led to an under-investment in skills and resource development. When the cycle finally turned and resource businesses tried to ramp up production, many found they did not have the people or the production equipment to do so. This led to a rapid escalation in staff costs and maintenance expenditure.
Production response
The oil price first exceeded US$60 in August 2005; at the time, this was considered a high enough price to encourage rapid supply growth. However, since 2005, non-OPEC oil supply has only grown by a cumulative 1.7%. OPEC oil supply has increased but almost all the spare capacity is in the hands of Saudi Arabia. A low oil price is not in the Saudis' best interests as oil is a finite resource and, as a sensible resource owner, they will maximise the net present value of the resource by not selling oil at what they consider a low price. Interestingly, even $80 does not seem to be resulting in much of a supply response.
China and the commodity markets
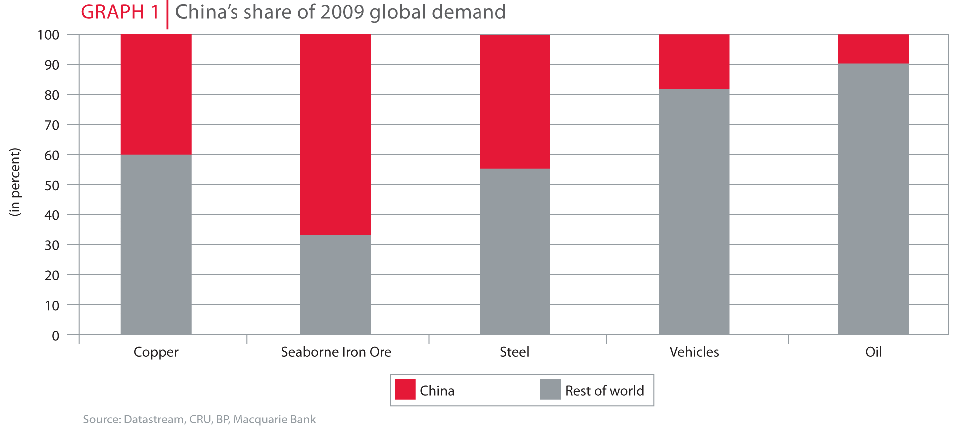
Graph 1 shows how over the past decade China was pretty much the only show in town for most industrial commodities. Consider copper, where Chinese demand growth was 22% per year while demand in the rest of the world declined by 2% per year. The combined effect was global growth of 2.5% per year and a very tight copper market.
OVER THE PAST DECADE CHINA WAS PRETTY MUCH THE ONLY SHOW IN TOWN FOR MOST INDUSTRIAL COMMODITIES
The story is similar in seaborne iron ore where, since 1999, Chinese demand increased from 55 million tons (mt) to 623mt while demand from the rest of the world declined from 347mt to 314mt. Most commodity analysts expect Chinese iron ore demand to be about one billion tons by 2015. Fortunately, the strong demand and consequent high prices have led to record levels of investment in iron ore production so there should be sufficient ore available to meet the forecast Chinese demand.
We do not know whether Chinese iron ore demand will grow by 60 to 70mt per year for the next five years. Nevertheless, an investor can be fairly sure that the 'China Effect' is priced into the iron ore producers, as both production growth and prices high enough to stimulate rapid supply growth are discounted in the share prices.

Contrast the iron ore market with the oil market where China accounts for only 10% of demand and current oil prices are not sufficient to stimulate rapid supply growth.
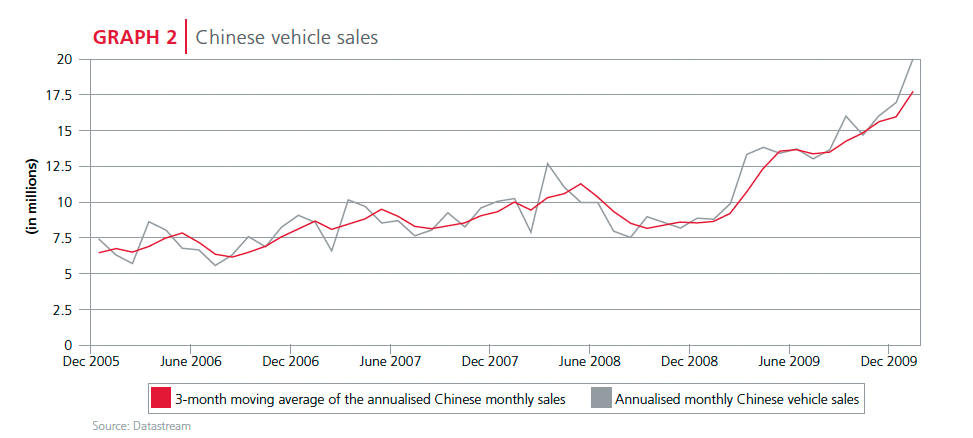
The outlook for oil demand in China is positive. Graph 2 shows that in 2009, 13.6 million vehicles were sold in the country, which was a 48% increase on 2008 sales. Sales over the past three months increased to an annualised rate of 17.5 million units. For context, global vehicle sales were 75 million in 2009, China thus accounted for 18% of vehicle demand but only 10% of oil demand. It follows that, as the Chinese consumer becomes wealthier, more people will drive cars and oil consumption will increase. The government is spending enough money on infrastructure to ensure there are sufficient roads available for the rapidly growing fleet of cars.
Sasol relative to other commodity producers
Sasol is our preferred resource share because of relative commodity prices and the impact of Chinese demand on these commodities. The share prices of diversified mining companies have substantially priced in the China story so the possibility for upside surprise in these stocks is limited. However, if Chinese growth does not meet expectations or if commodity prices fall once supply exceeds demand, the downside to earnings and valuations could be severe. Conversely, the oil price and oil shares have not felt the full impact of Chinese demand growth and seem to have more downside support as producers are not generating super profits and the oil price is not far above the marginal cost of production.
Normal margins check
To check if normal earnings forecasts are reasonable, it is important to look at the historic margins of the business. If the forecast margin is well above or well below the historic norm, one should question the assumptions on which the forecast is based. Excluding the Olefins and Surfactants (O&S) business, Sasol's operating margin has averaged 28% since 1997. The R600bbl forecast yields a 25% margin, which seems reasonable. (O&S has been excluded as it is a low margin, high revenue business that was only acquired in 2003 and distorts the numbers slightly.
THE OIL PRICE IN RANDS IS THE MOST IMPORTANT DRIVER OF SASOL'S EARNINGS
Conclusion
We believe Sasol is an attractively-priced share with good upside potential relative to a market that has priced in aggressive earnings growth assumptions.